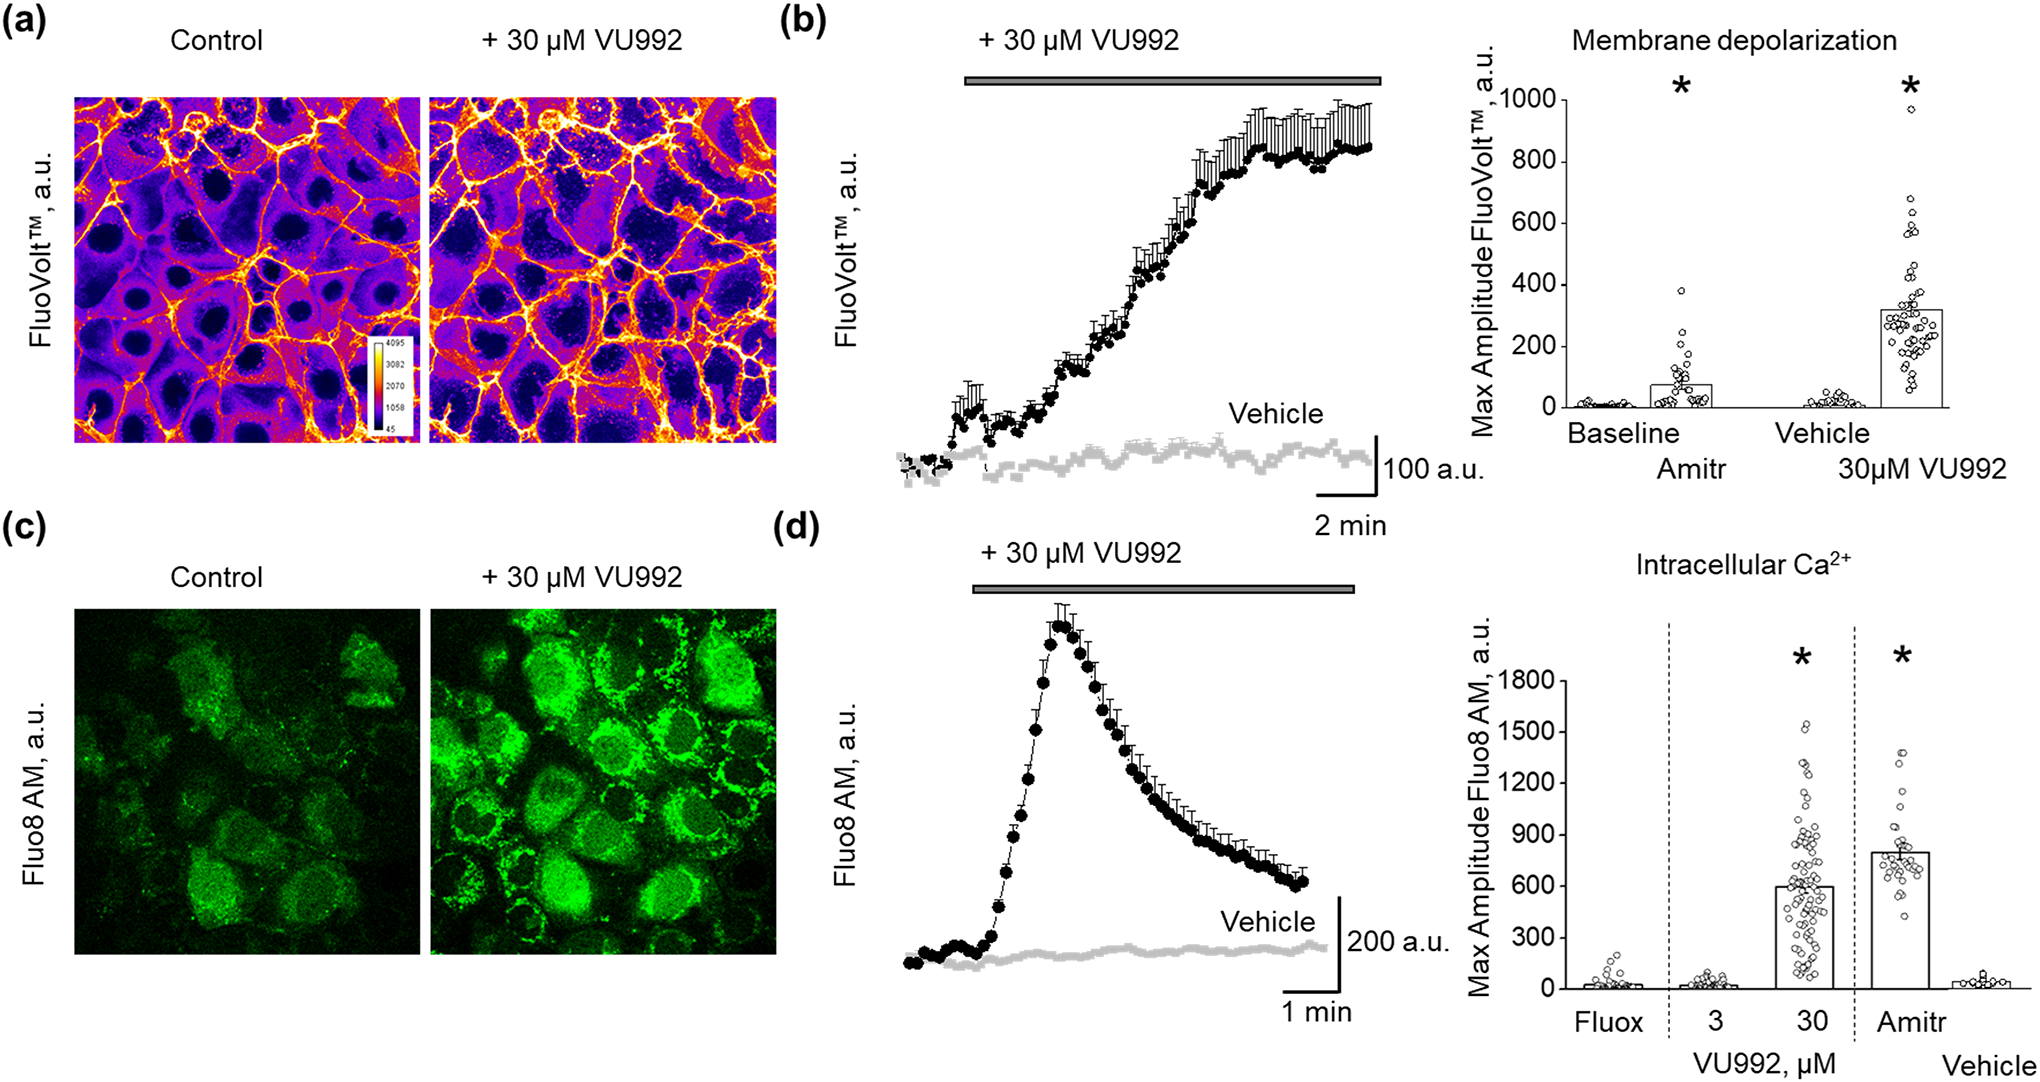
FIGURE 4.

Effect of Kir4.1 and Kir4.1/Kir5.1 channels inhibitors on the membrane potential and intracellular Ca2+ concentrations in mCCDcl1 cells. (a) Representative confocal images of mCCDcl1 cells loaded with membrane potential dye (FluoVolt) acquired before and after application of VU992 with the corresponding graph plotting the time course of changes in the FluoVolt fluorescence intensity pooled from six cells. (b) Summary graph of the peak FluoVolt fluorescence intensity following application of amitriptyline (n = 27) or VU992 (n = 66). PSS or DMSO as a vehicle control shown in grey. One Way RM ANOVA, *P < 0.05. (c) Confocal images of Fluo8HT-stained mCCDcl1 cells acquired before and after application of VU992 with the corresponding graph plotting the time course of VU992-induced intracellular calcium transient pooled from ten cells. (d) Summary graph for the peak Fluo8HT fluorescence intensity following application of fluoxetine (n = 40), 3 μM VU992 (n = 40), 30 μM VU992 (n = 95), and amitriptyline (n = 28). PSS or DMSO as a vehicle control shown in grey. One Way ANOVA, Tukey post-hoc test, *P < 0.05 compared to vehicle, fluoxetine, and 3 μM VU992. Scale bar is 20 μm.
