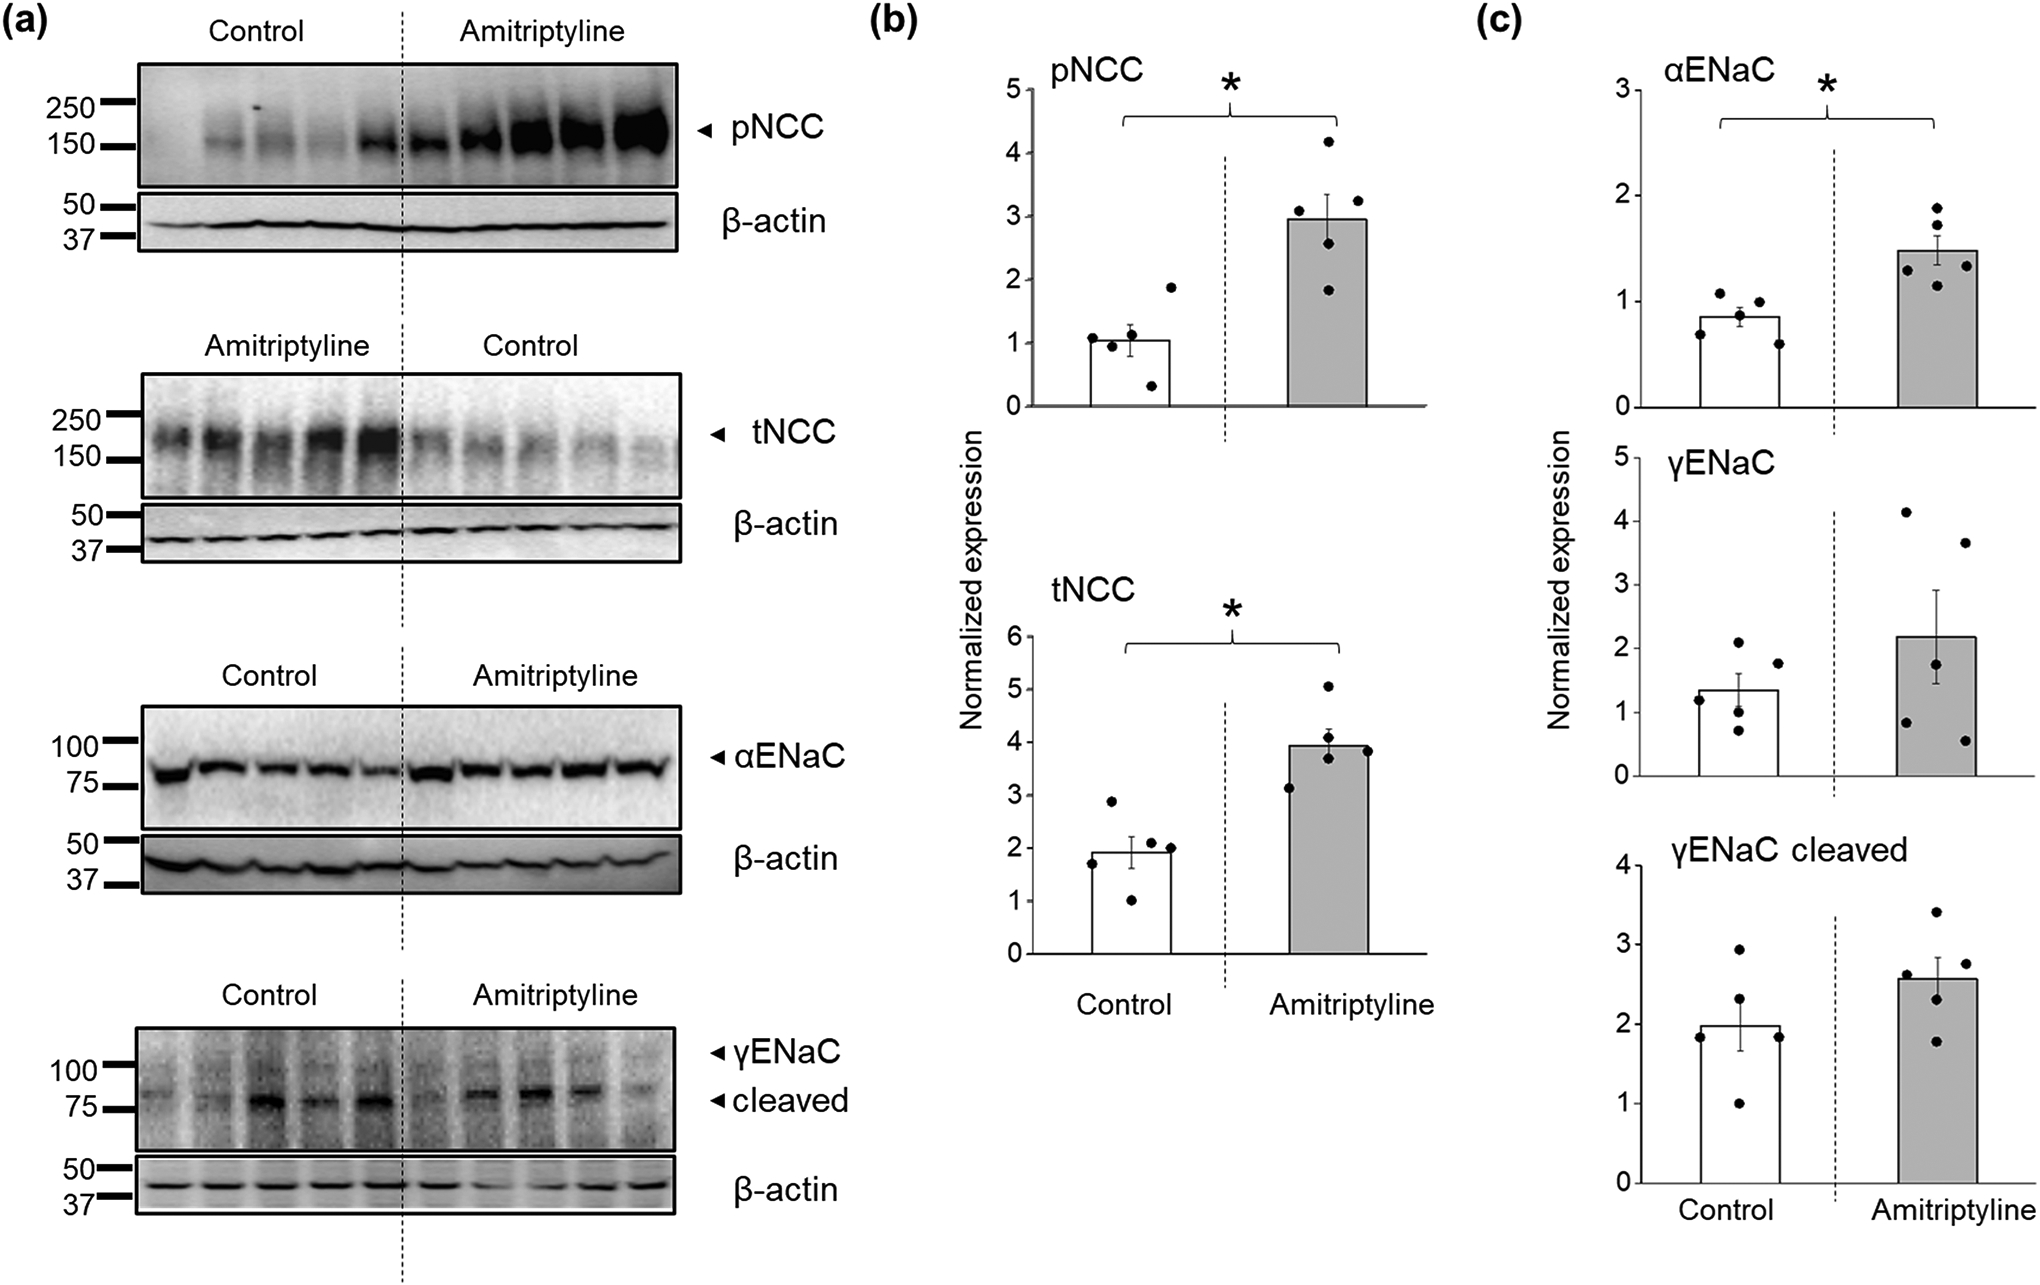
FIGURE 8.

Differences in NCC and ENaC expression in SS rats treated with amitriptyline. (a) Western blotting analysis of tNCC, pNCC, αENaC, cleaved and noncleaved γENaC subunits from the kidney cortex lysates of SS rats under control or after 3 days of i.p. injection with amitriptyline. (b, c) Summary graphs showing the average relative density of the bands (normalized to loading controls) in the studied groups (n = 5 per each group, ANOVA, *P < 0.05).
