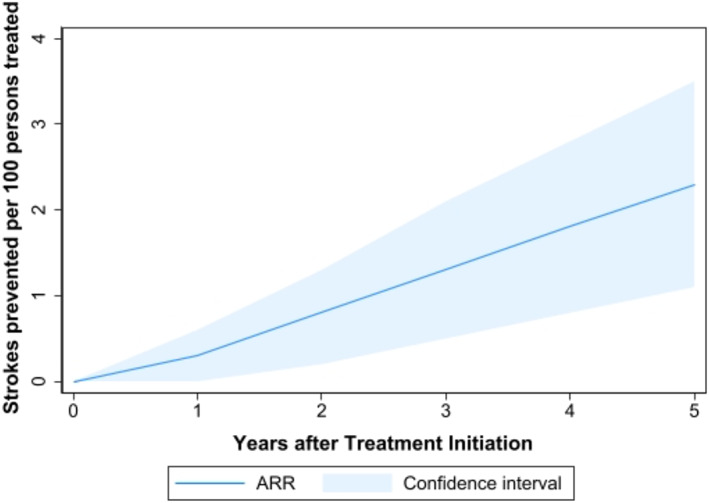
FIGURE 2.

Meta‐analyzed absolute risk reduction over time with more intensive blood pressure treatment. The dark blue line signifies the difference in number of stroke events between standard and more intensive blood pressure treatment groups. The light blue areas above and below the line indicate the upper and lower 95% confidence limits of the ARR, respectively
