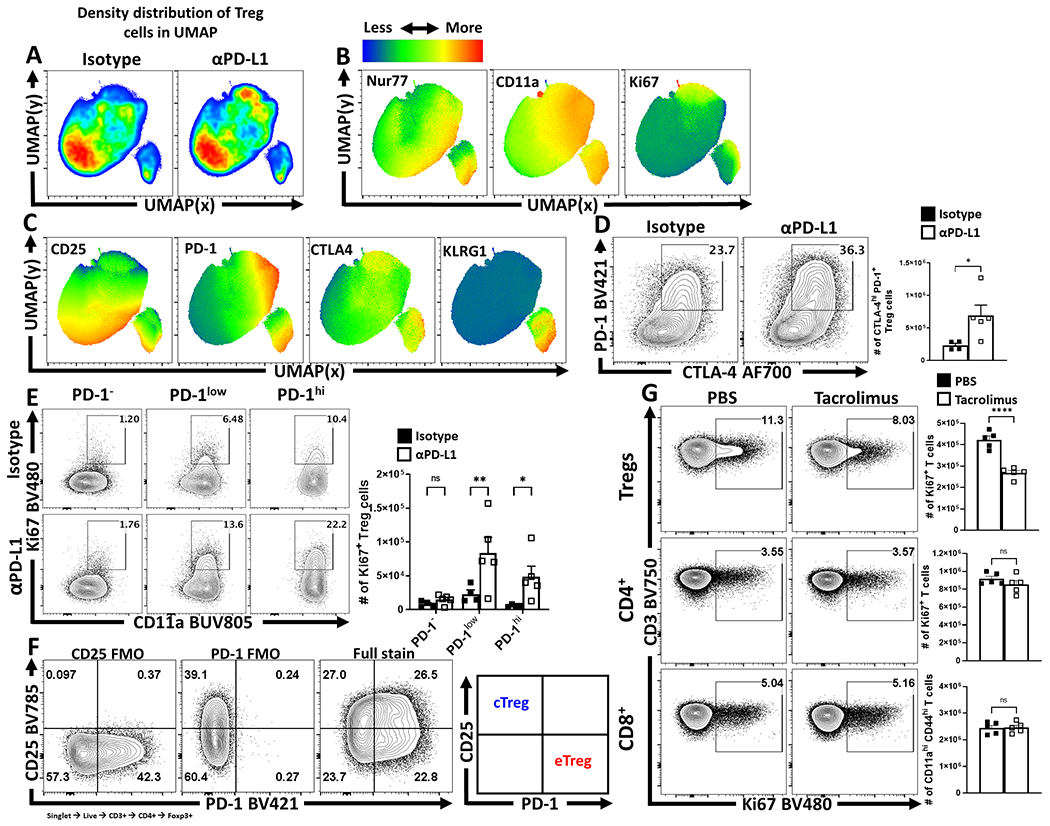
Extended Figure 4. Anti-PD-L1 blockade results in increased eTreg cell activation and proliferation in naïve hosts.

(A-C) 9 week-old male Nur77GFP reporter mice were treated with a single dose of isotype or anti-PD-L1 blocking antibody for 72 hours. Splenocytes were then harvested and assessed via high-parameter flow cytometry. Treg cell data was then concatenated between the isotype and anti-PD-L1 treated groups, and the subsequent qualitative interpretation was conducted via UMAP analysis (excluding Foxp3, PD-1, PD-L1, and CD4 as calculation factors). (A) Side-by-side pseudo-color density plot comparison of Treg cells from isotype and anti-PD-L1 treated hosts depicting regional shifts within the same UMAP calculation. (B) Heatmap expression analysis across the total combined UMAP data from both groups, depicting median heatmaps of TCR activation associated proteins Nur77, CD11a, and Ki67, with overlapping enrichment of activated Treg cells in anti-PD-L1 treated hosts. (C) Additional heatmap analysis of Treg cell associated CD25, inhibitory receptors PD-1 and CTLA-4, and KLRG-1, with an enrichment of overlap between PD-1, CTLA-4, and KLRG1 expression in context of PD-L1 blockade. (D-F) 9 week-old male C57BL/6 mice were also treated with a single dose of isotype (n = 4) or anti-PD-L1 blocking antibody (n = 5) for 72 hours, and their splenocytes were also isolated and analyzed via high-parameter flow cytometry. (D) Flow plot data of splenic Treg cells from isotype and anti-PD-L1 treated hosts comparing changes to the PD-1+ CTLA-4hi subset following PD-L1 blockade (two-tailed unpaired student’s t-test, * = p = 0.0394, 4 experimental replicates). (E) Treg cells from isotype and PD-L1 blockade treated hosts, gated on activated (CD11ahi) cells in cell cycle (Ki67+), indicating an increase in PD-1+ Treg cells in cell cycle following treatment (2-way ANOVA with Fisher’s LSD individual comparisons test, * = p = 0.032, ** = p = 0.0037, 4 experimental replicates). (F) Gating strategy utilized for flow cytometry sorting to isolate cTreg cells (CD25+ PD-1−) vs eTreg cells (CD25− PD-1+). (G) Flow cytometry data of Treg, CD4+ Tconv, and CD8+ T cells for the expression of Ki67 following 96 hours of tacrolimus (FK506) treatment (n = 5/group two-tailed unpaired student’s t-test, **** = p < 0.0001, 2 experimental replicates). All data presented are means +/− SEM and show individual data points.
