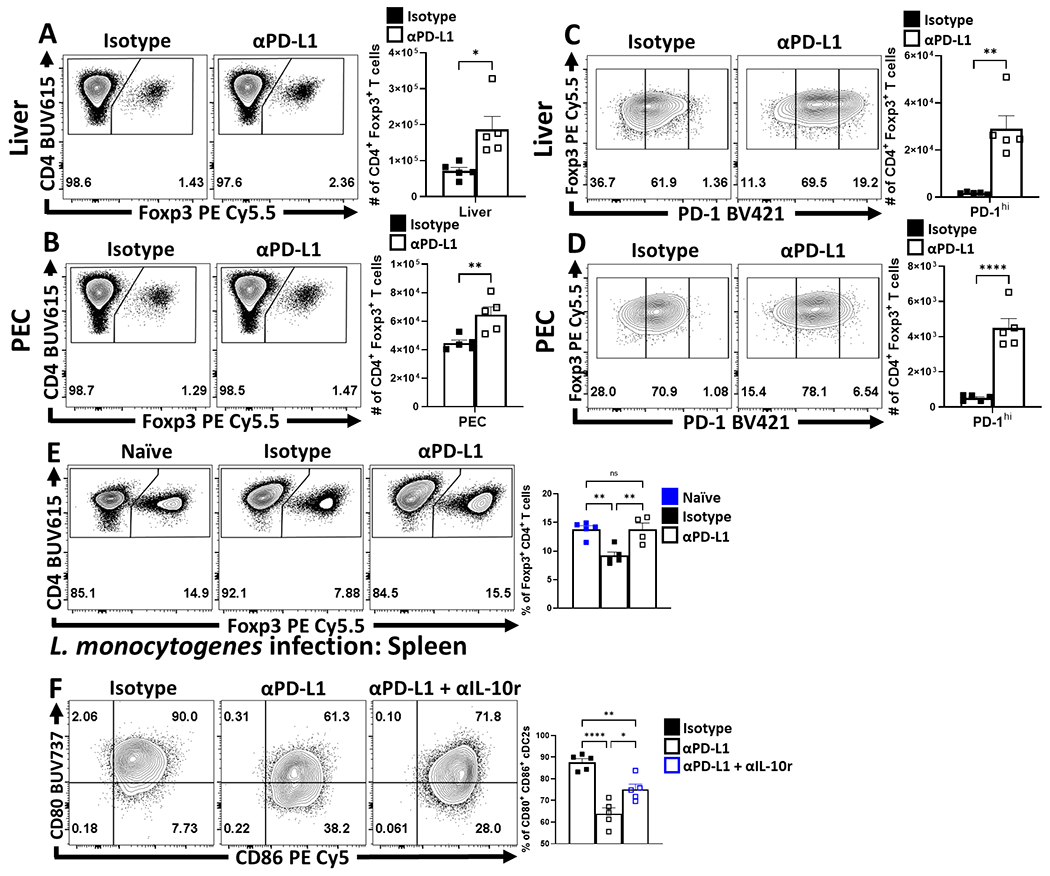
Extended Figure 7. Impact of PD-L1 blockade across tissues and infection.

(A-D) Cohorts of 8 week-old male C57BL/6 mice were treated with an isotype antibody or PD-L1 blocking antibody 24 hours prior to infection with 20 cysts of ME49 IP. The antibody treatments were repeated every 72 hours throughout the course of infection until the mice were killed on day 10 and PEC, spleen, and liver were harvested and analyzed via high-parameter flow cytometry. (A-B) Flow plots of bulk CD4+ T cells with subsequent gates on the Foxp3+ T cells (Treg cells) for liver (A) and PEC (B), demonstrating the drop in Treg cells from homeostatic levels during infection, and the maintenance of Tregs during infection with PD-L1 blocking antibody treatment (n = 5/group two-tailed unpaired student’s t-test, * = p = 0.0153, ** = p = 0.0088, 4 experimental replicates). (C-D) Flow plots of Treg cells from treatment groups showing enrichment of PD-1hi Treg compartment as a consequence of PD-L1 blockade treatment during infection in liver (C), and PEC (D) (n = 5/group two-tailed unpaired student’s t-test, ** = p = 0.0013, **** = p < 0.0001, 4 experimental replicates). (E) Cohorts of 8 week-old male C57BL/6 mice were treated with an isotype antibody (n = 5 uninfected, n = 5 infected) or PD-L1 blocking antibody (n = 4) 24 hours prior to intravenous infection with 104 pfu of L. monocytogenes cysts of ME49 IP. The antibody treatments were repeated every 72 hours until splenocytes were harvested and analyzed via high-parameter flow cytometry on day 6 of infection. Depicted are flow plots of splenocyte-derived bulk CD4+ T cells gated on Foxp3+ T cells (Treg cells), (1-way ANOVA with Tukey’s multiple comparisons test, Isotype naïve vs Isotype infected: ** = p = 0.0033, Isotype infected vs anti-PD-L1 infected: ** = p = 0.0055, 1 experimental replicate). (F) Splenocyte-derived flow plots of cDC2s from cohorts of 8 week-old male C57BL/6 mice at day 10 of infection with T. gondii (20 cysts ME49 IP), that had been treated with isotype (n = 5), anti-PD-L1 (n = 5), with the inclusion of an additional cohort treated with a combination of blocking anti-IL-10r/anti-PD-L1 antibodies (n = 5) depicting exvivo changes in the proportion of CD80+ CD86+ cells (n = 5/group, 1-way ANOVA with Tukey’s multiple comparisons test, * = p = 0.0117, ** = p = 0.0056, **** = p < 0.0001, 2 experimental replicates). All data presented are means +/− SEM and show individual data points.
