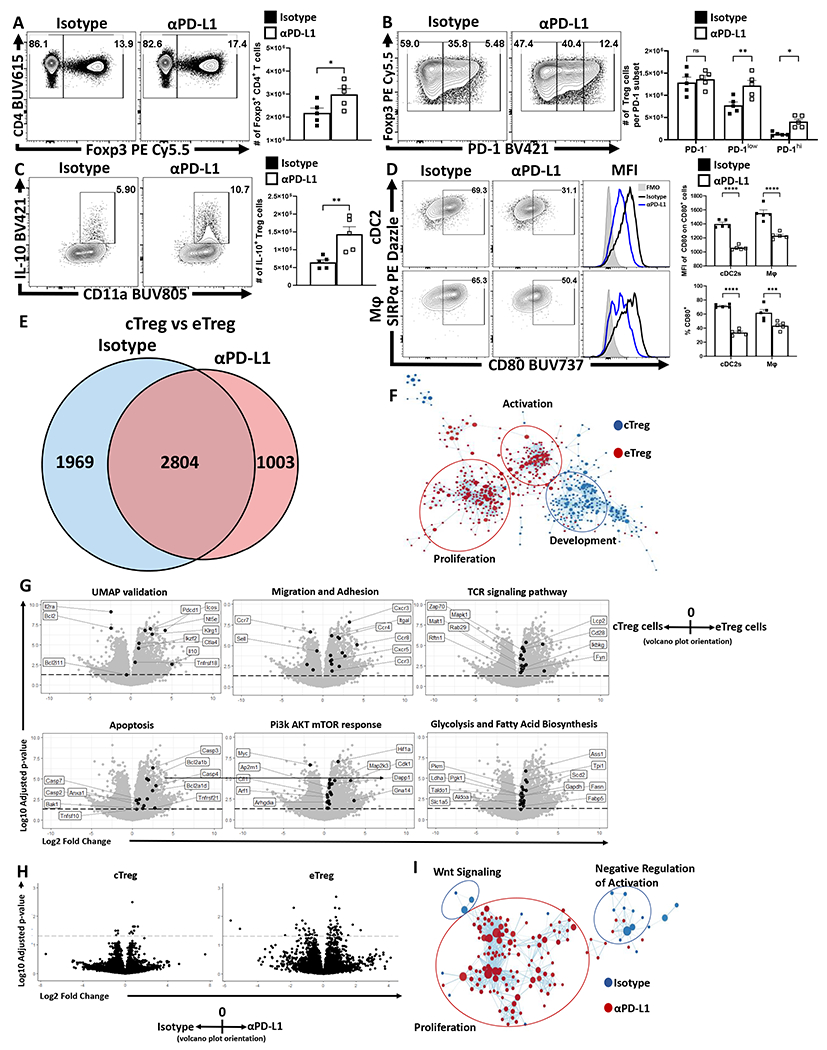
Figure 2: PD-1 signaling restrains eTreg populations at homeostasis.

(A-D) Naïve 8-week old male C57BL/6 mice were intraperitoneally injected with IgG2b isotype antibody or anti-PD-L1 blocking antibody. After 72 hours, splenocytes were harvested and analyzed via high-parameter flow cytometry (A-D data presented are means +/− SEM and show individual data points). (A) Flow cytometry plots of CD4 cells depicting changes in the Foxp3+ subset following treatment (n = 4/group two-tailed unpaired student’s t test, * = p = 0.0395, 4 experimental replicates). (B) Plots of Treg cells depicting enrichment in the PD-1low, and PD-1hi subsets following PD-L1 blockade at homeostasis (n = 5/group, 2-way ANOVA with Fisher’s LSD individual comparisons test, * = p = 0.0298, ** = p = 0.0012, 4 experimental replicates). (C) Splenocytes from these treated cohorts were also incubated with PMA/ionomycin and then stained for cytokine production of IL-10. Cytokine staining data depicting an increase in Treg expression of IL-10 following PD-L1 blockade treatment (n = 5/group two-tailed unpaired student’s t-test, ** = p = 0.0072, 4 experimental replicates). (D) Plots depicting the CD80+ proportions of cDC2s (CD3−, B220−, CD19−, NK1.1−, Ly6G−, CD64−, CD11c+, MHC-II+, SIRPα+) and macrophages (CD3−, B220−, CD19−, NK1.1−, Ly6G−, CD64+, CD11b+, MHC-II+, Ly6Clow), with subsequent MFI comparisons of CD80 expression on CD80+ cells (n = 5/group, 2-way ANOVA with Sidak’s multiple comparisons test, *** = p = 0.0007, **** = p < 0.0001, 3 experimental replicates). (E-F) Splenocyte derived Treg cells were isolated from naïve 9-week old male Foxp3EGFP mice following 72 hour isotype or PD-L1 blockade treatment (n = 4/group) were double sorted into cTreg (CD25+ PD-1−) and eTreg (CD25− PD-1+) subsets for RNAseq analysis. (E) Transcriptomic data was normalized across biological replicates and compared for differentially expressed genes between cTreg and eTreg pools, and then specific differences were identified comparing cTreg to eTreg cells within isotype or PD-L1 blockade treated hosts (Linear-fit model with Benjamini-Hochberg correction, p < 0.05, log2 fold change > 0.3). (F) GSEA analysis matrix plot depicting transcriptomic divergence of cTreg and eTreg cells between pathways of proliferation, activation, and development. (G) Volcano-plot comparisons of significant transcript differences in relation to previously identified proteins via flow cytometry (UMAP validation), gene signatures associated with migration and adhesion, TCR signaling, apoptosis, Pi3k/AKT/mTOR, and glycolysis, cTreg values are depicted to the left of 0 on the x-axis, and eTreg values are on the right of 0 on the x-axis (Linear-fit model with Benjamini-Hochberg correction, p < 0.05 = threshold line). (H) Volcano-plot comparisons of cTregs (left plot) and eTregs (right plot) depicting the impact of anti-PD-L1 blockade treatment (cells from isotype treated hosts on the left of 0 on the x-axis, and cells from anti-PD-L1 treated hosts on the right of the x-axis) (Linear-fit model with Benjamini-Hochberg correction, p < 0.05 = threshold line). (I) GSEA analysis examining the impact of anti-PD-L1 blockade on eTregs, demonstrating changes to Wnt signaling, proliferation, and negative regulation of activation transcripts with treatment.
