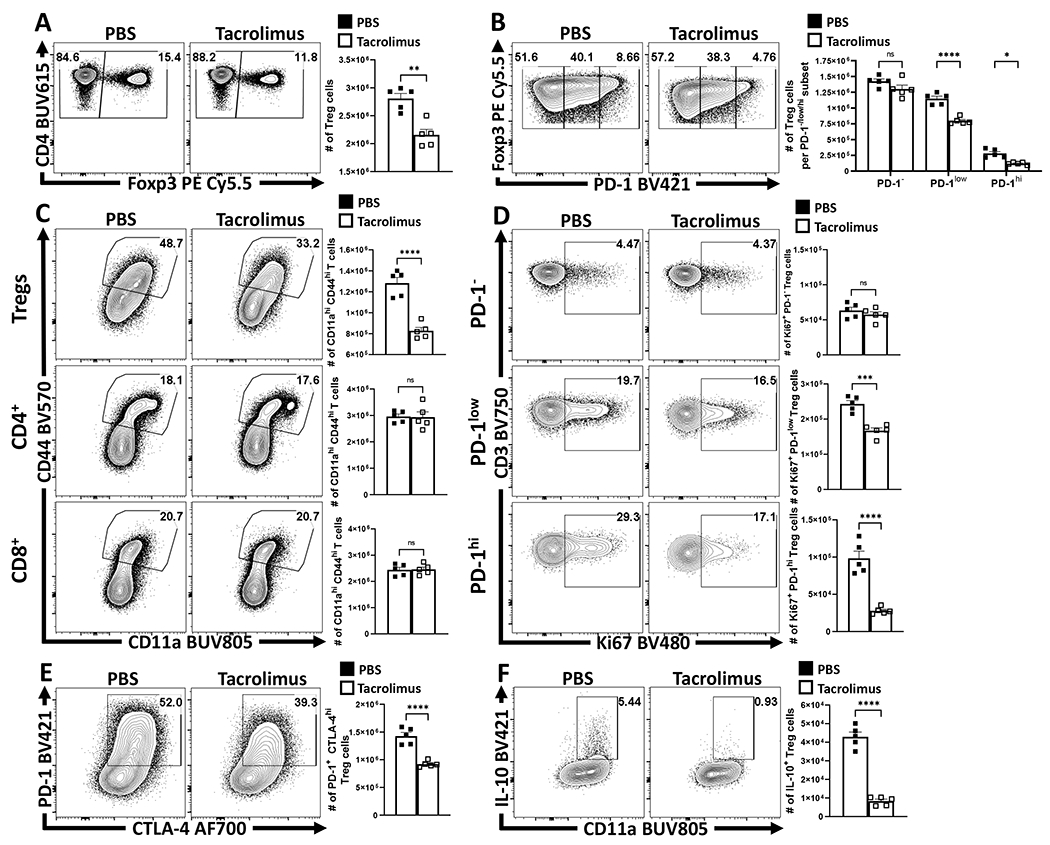
Figure 3: TCR signals are necessary to maintain eTreg populations at homeostasis.

Cohorts of 8 week-old male C57BL/6 mice (n = 5/group) were treated once daily for 4 days with subcutaneous injections of PBS or Tacrolimus (FK506), and splenocytes were harvested and analyzed via high-parameter flow cytometry (2 experimental replicates). (A) Plots depicting drop in proportion and number of Treg cells with FK506 treatment (two-tailed unpaired student’s t-test, ** = p = 0.0012). (B) Plots depicting further changes to the Treg cell compartment in context of PD-1−, PD-1low, PD-1hi subsets (2-way ANOVA with Sidak’s multiple comparisons test, * = p = 0.0162, **** = p < 0.0001). (C) Plots depicting proportion and numbers of activated (CD44hi CD11ahi) Treg, Foxp3− CD4+ Tconv, and CD8+ T cells between PBS and FK506 treated hosts (two-tailed unpaired student’s t-test, **** = p < 0.0001). (D) Plots depicting changes proportion and number of Ki67+ Treg cells amongst PD-1−, PD-1low, PD-1hi subsets (two-tailed unpaired student’s t-test, *** = p = 0.0003, **** = p < 0.0001). (E) Plots demonstrating changes to the PD-1+ CTLA-4hi Treg cell subset following FK506 treatment (two-tailed unpaired student’s t-test, **** = p < 0.0001). (F) Cytokine stain plots of IL-10 on Treg cells from PBS and Tacrolimus hosts (two-tailed unpaired student’s t-test, **** = p < 0.0001). All data presented are means +/− SEM and show individual data points.
