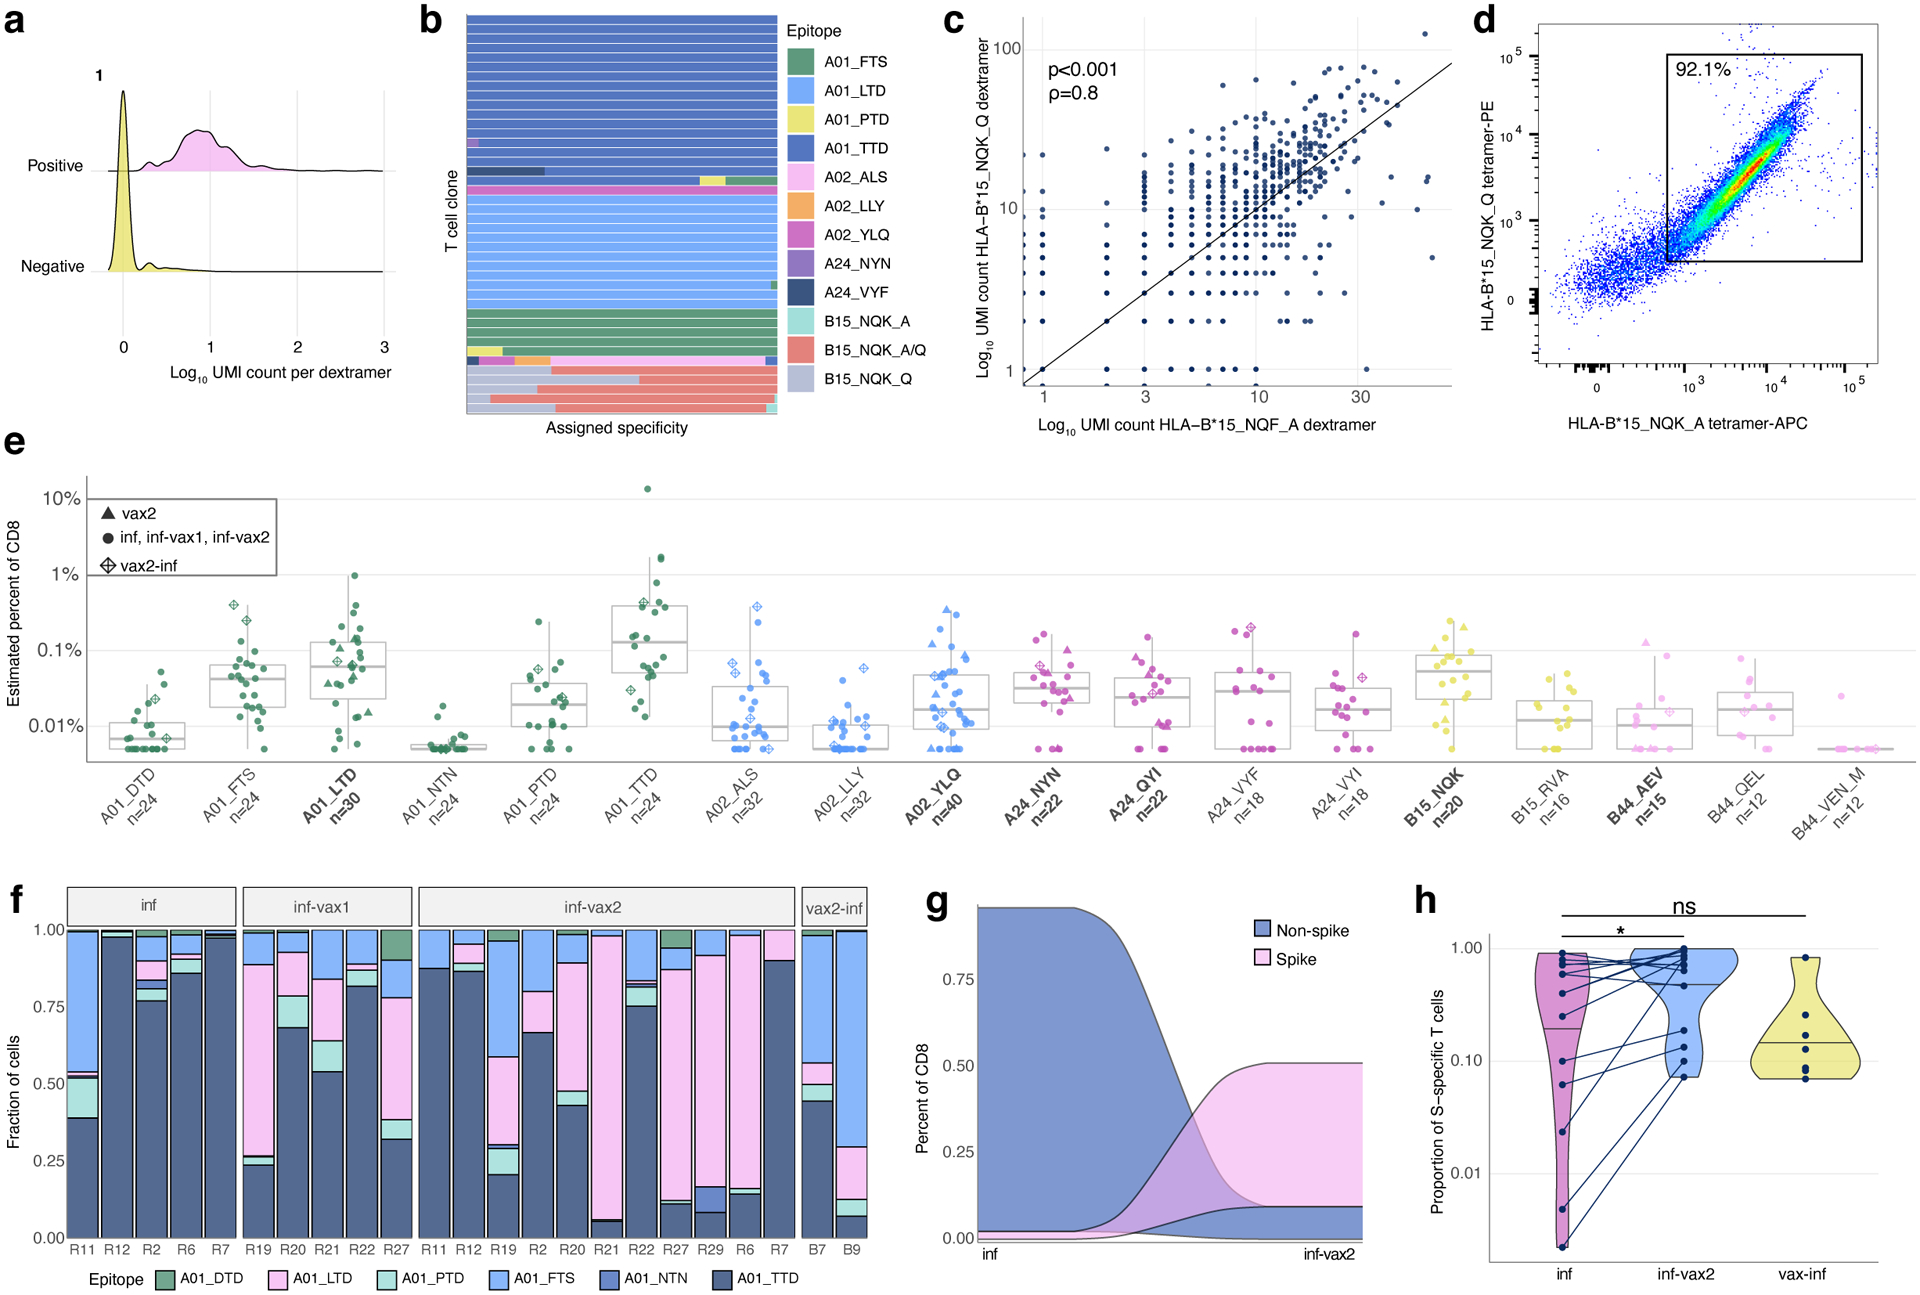
Figure 2. Magnitude, dynamics, and cross-reactivity of CD8+ epitope-specific responses after diverse SARS-CoV-2 exposures.

a. Antigen specificity of each T cell inferred from dextramer-barcode UMI counts. Representative distribution of the number of UMIs in cells called dextramer-positive (pink) and dextramer-negative (yellow). b. T cells within a clone have largely consistent specificity assignments, except T cells that cross-react with common cold coronavirus epitopes (B15_NQK_A/B15_NQK_Q pair). Each bar shows a fraction of cells of a given clonotype attributed to different dextramers. The 43 most abundant clones (more than 20 cells) are shown. c. The correlation between the number of UMIs for B15_NQK_Q (SARS-CoV-2) and B15_NQK_A (OC43 and HKU1) dextramers (Spearman rank correlation ρ=0.8, two-sided test p<2.2·10−16). d. Cross-reactivity between HLA-B*15:01-NQK epitope variants confirmed in vitro. Jurkat cell line expressing αβTCR identified from scTCRseq data binds pMHC multimers loaded with both SARS-CoV-2 and CCCoV variants of the epitope. e. The magnitude of epitope-specific CD8+ T cell responses. Each point depicts an estimated frequency of epitope-specific T cells in a sample (n, number of samples is shown under x-axis labels). Estimated frequency was calculated as a fraction of dextramer-specific T cells in scRNAseq results multiplied by bulk frequency of dextramer-stained CD8+ cells of all CD8+cells measured by flow cytometry. Central line on boxplot shows the median. Epitopes from spike protein are in bold font. Boxes represent the median, 25th to 75th percentiles, whiskers are minimum to maximum but no further than 1.5 IQR. f. Composition of HLA-A*01-restricted T cell response in HLA-A*01 positive donors. Increasing proportion of spike-targeting T cells (pink) is observed after vaccination of infected individuals. g. Boosting of spike-specific epitope fraction after vaccination (donor R6). h. Previously infected individuals have a higher proportion of spike-specific T cells after vaccination than before vaccination (p=0.025, one-sided Wilcoxon signed-rank test). Spike T cell proportion (shown on a log10-scale) was calculated as a fraction of spike-specific T cells out of all CD8+ epitope-specific T cells of a donor in scRNAseq data (inf, n=14; inf-vax2, n=14; vax2-inf, n=7). Central line on violin plots shows the median, upper and lower borders show maximal and minimal values.
