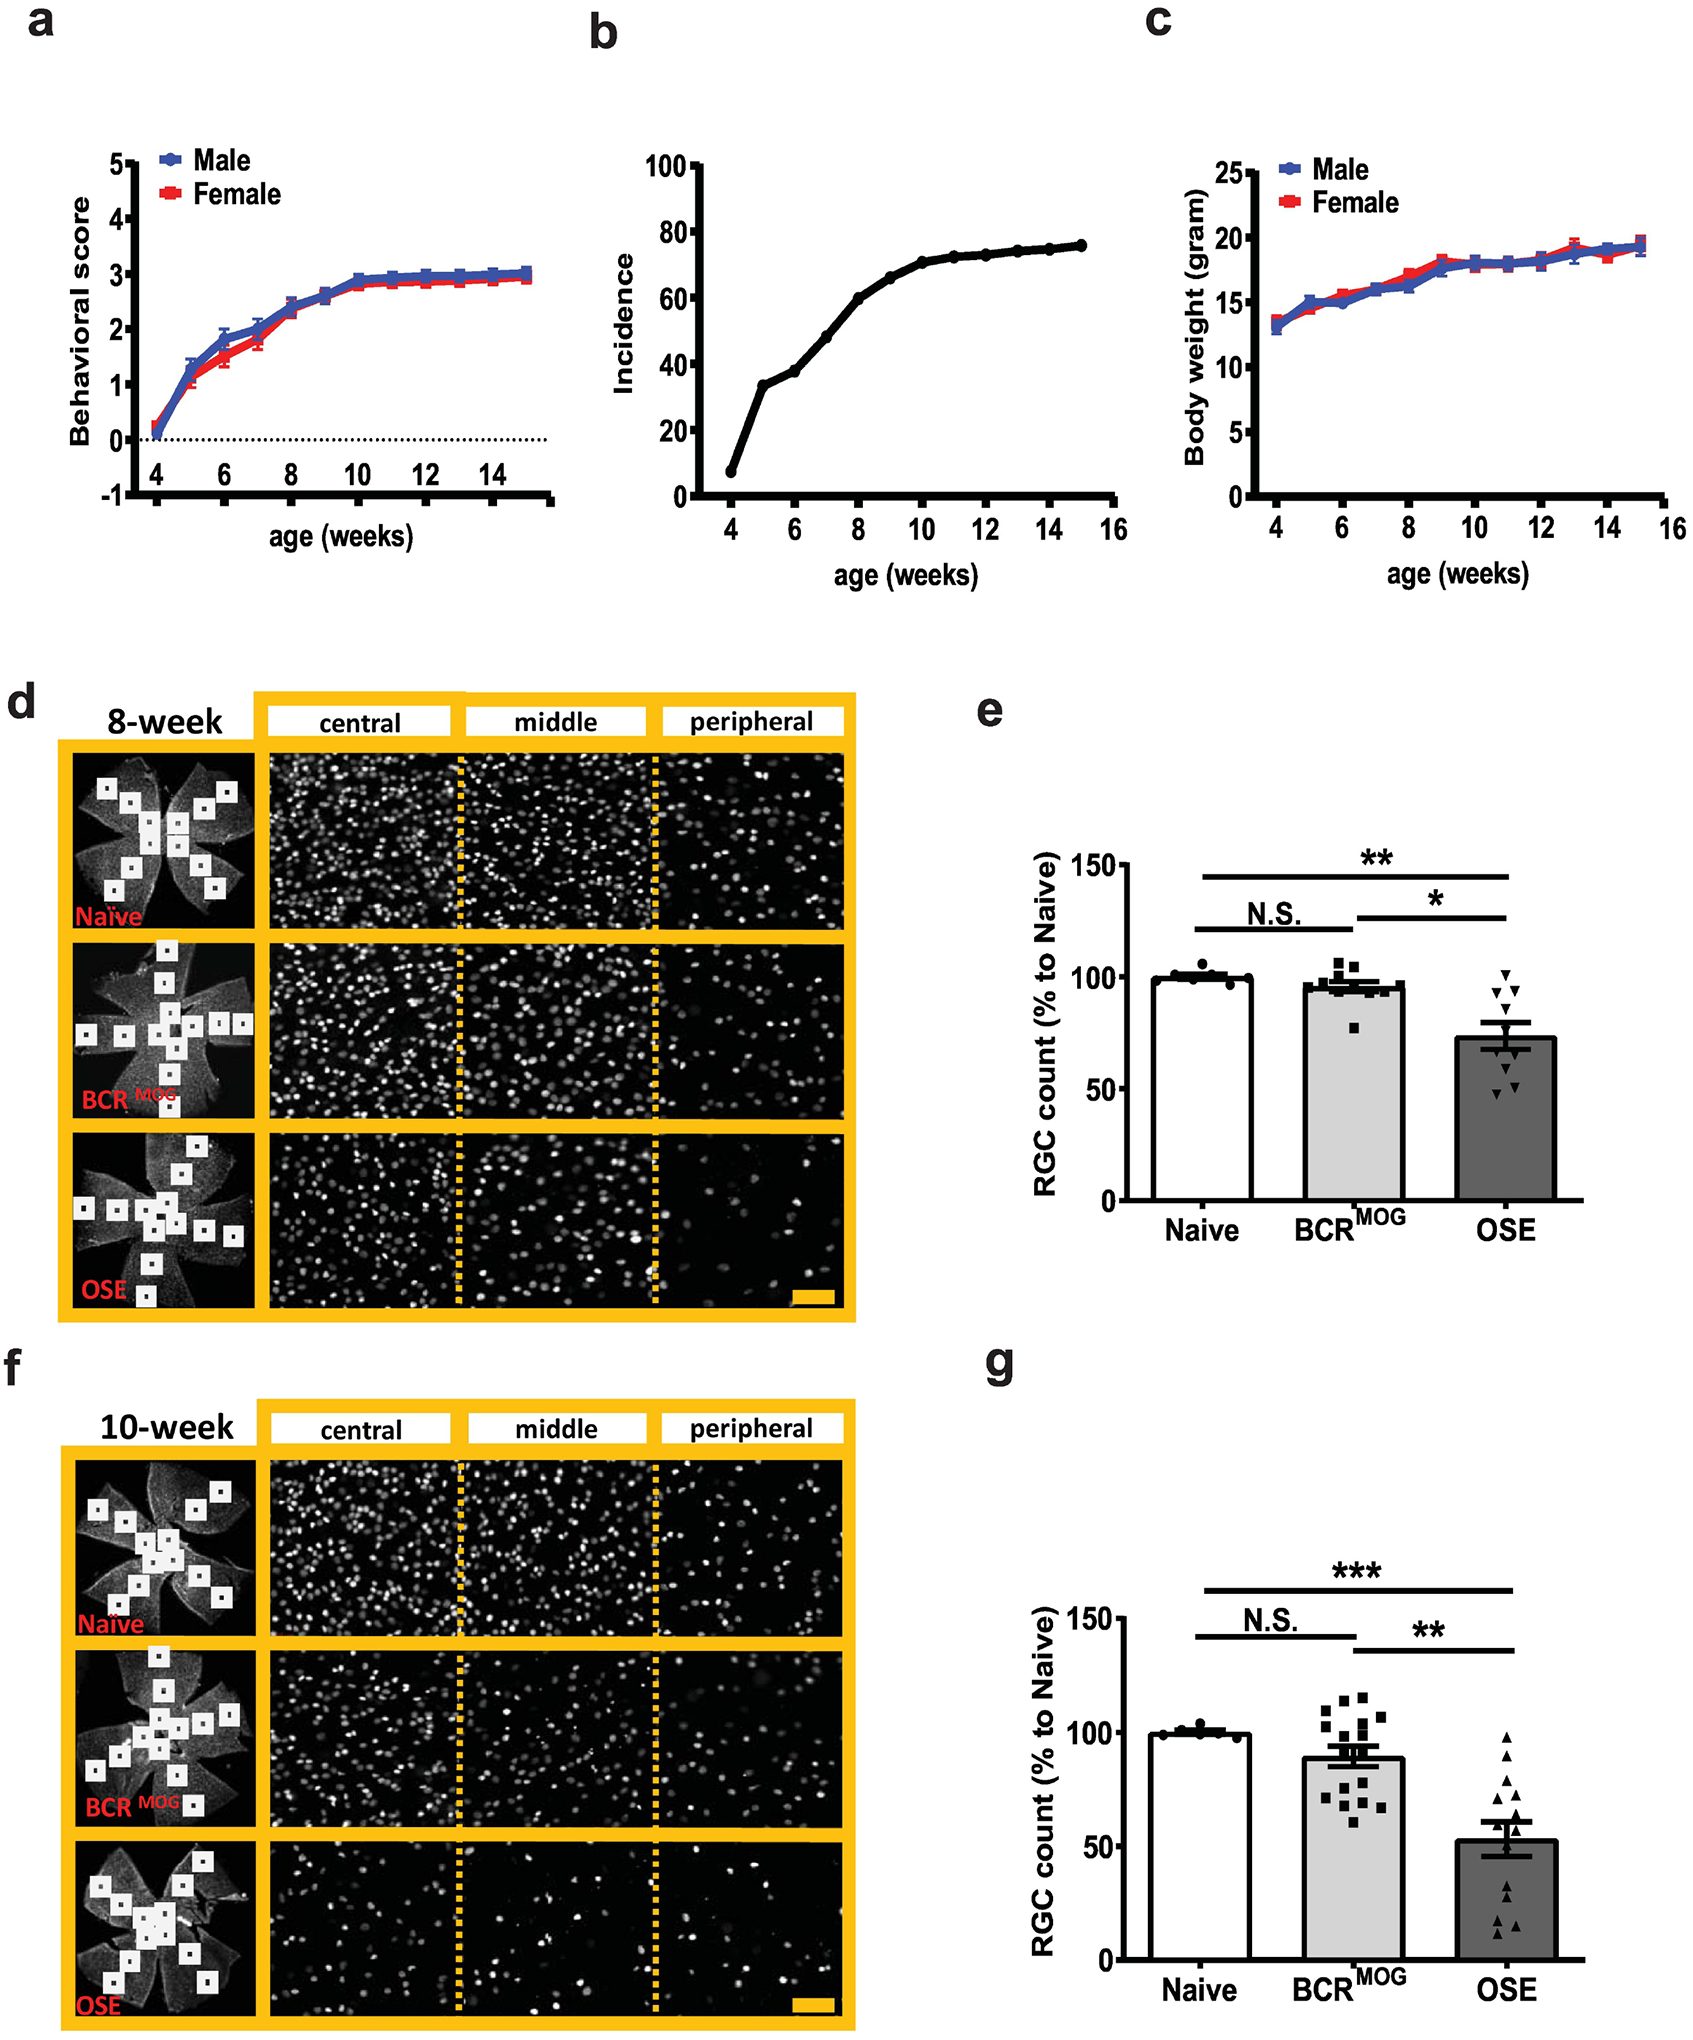
Figure 1. Retinal ganglion cell (RGC) counts in OSE mice.

a) Behavioral score of OSE mice. b) Incidence of OSE mice. c) Body weight of OSE mice. RGC number was counted in flat mount retinas stained with the RGC specific marker, Brn-3a, in 8-week-old and 10-week-old mice, respectively. d) Representative images of Brn3a staining in flat-mount whole retinas from 8-week-old mice. e) Quantification of Brn3a+ RGC for 8-week-old mice (F=12.05, p=0.0002. Naïve vs BCRMOG, P=0.7353; Naïve vs OSE, P=0.0006; BCRMOG vs OSE, P=0.0012). f) Representative images of Brn3a staining in flat-mount whole retinas from 10-week-old mice. g) Quantification of Brn3a+ RGC count for 10-week-old mice (F=14.74, p<0.0001. Naïve vs BCRMOG, P=0.5623; Naïve vs OSE, P=0.0003; BCRMOG vs OSE, P=0.0001). Each dot from bar graph represents a mouse RGC count from the average of 12 segments of flat mount retina. Significance of RGC between groups was assessed by one-way ANOVA (** P ≤ 0.01, *** P ≤ 0.001, N.S. = no significance). Error bars represent SEM. Scale bar=20μm.
