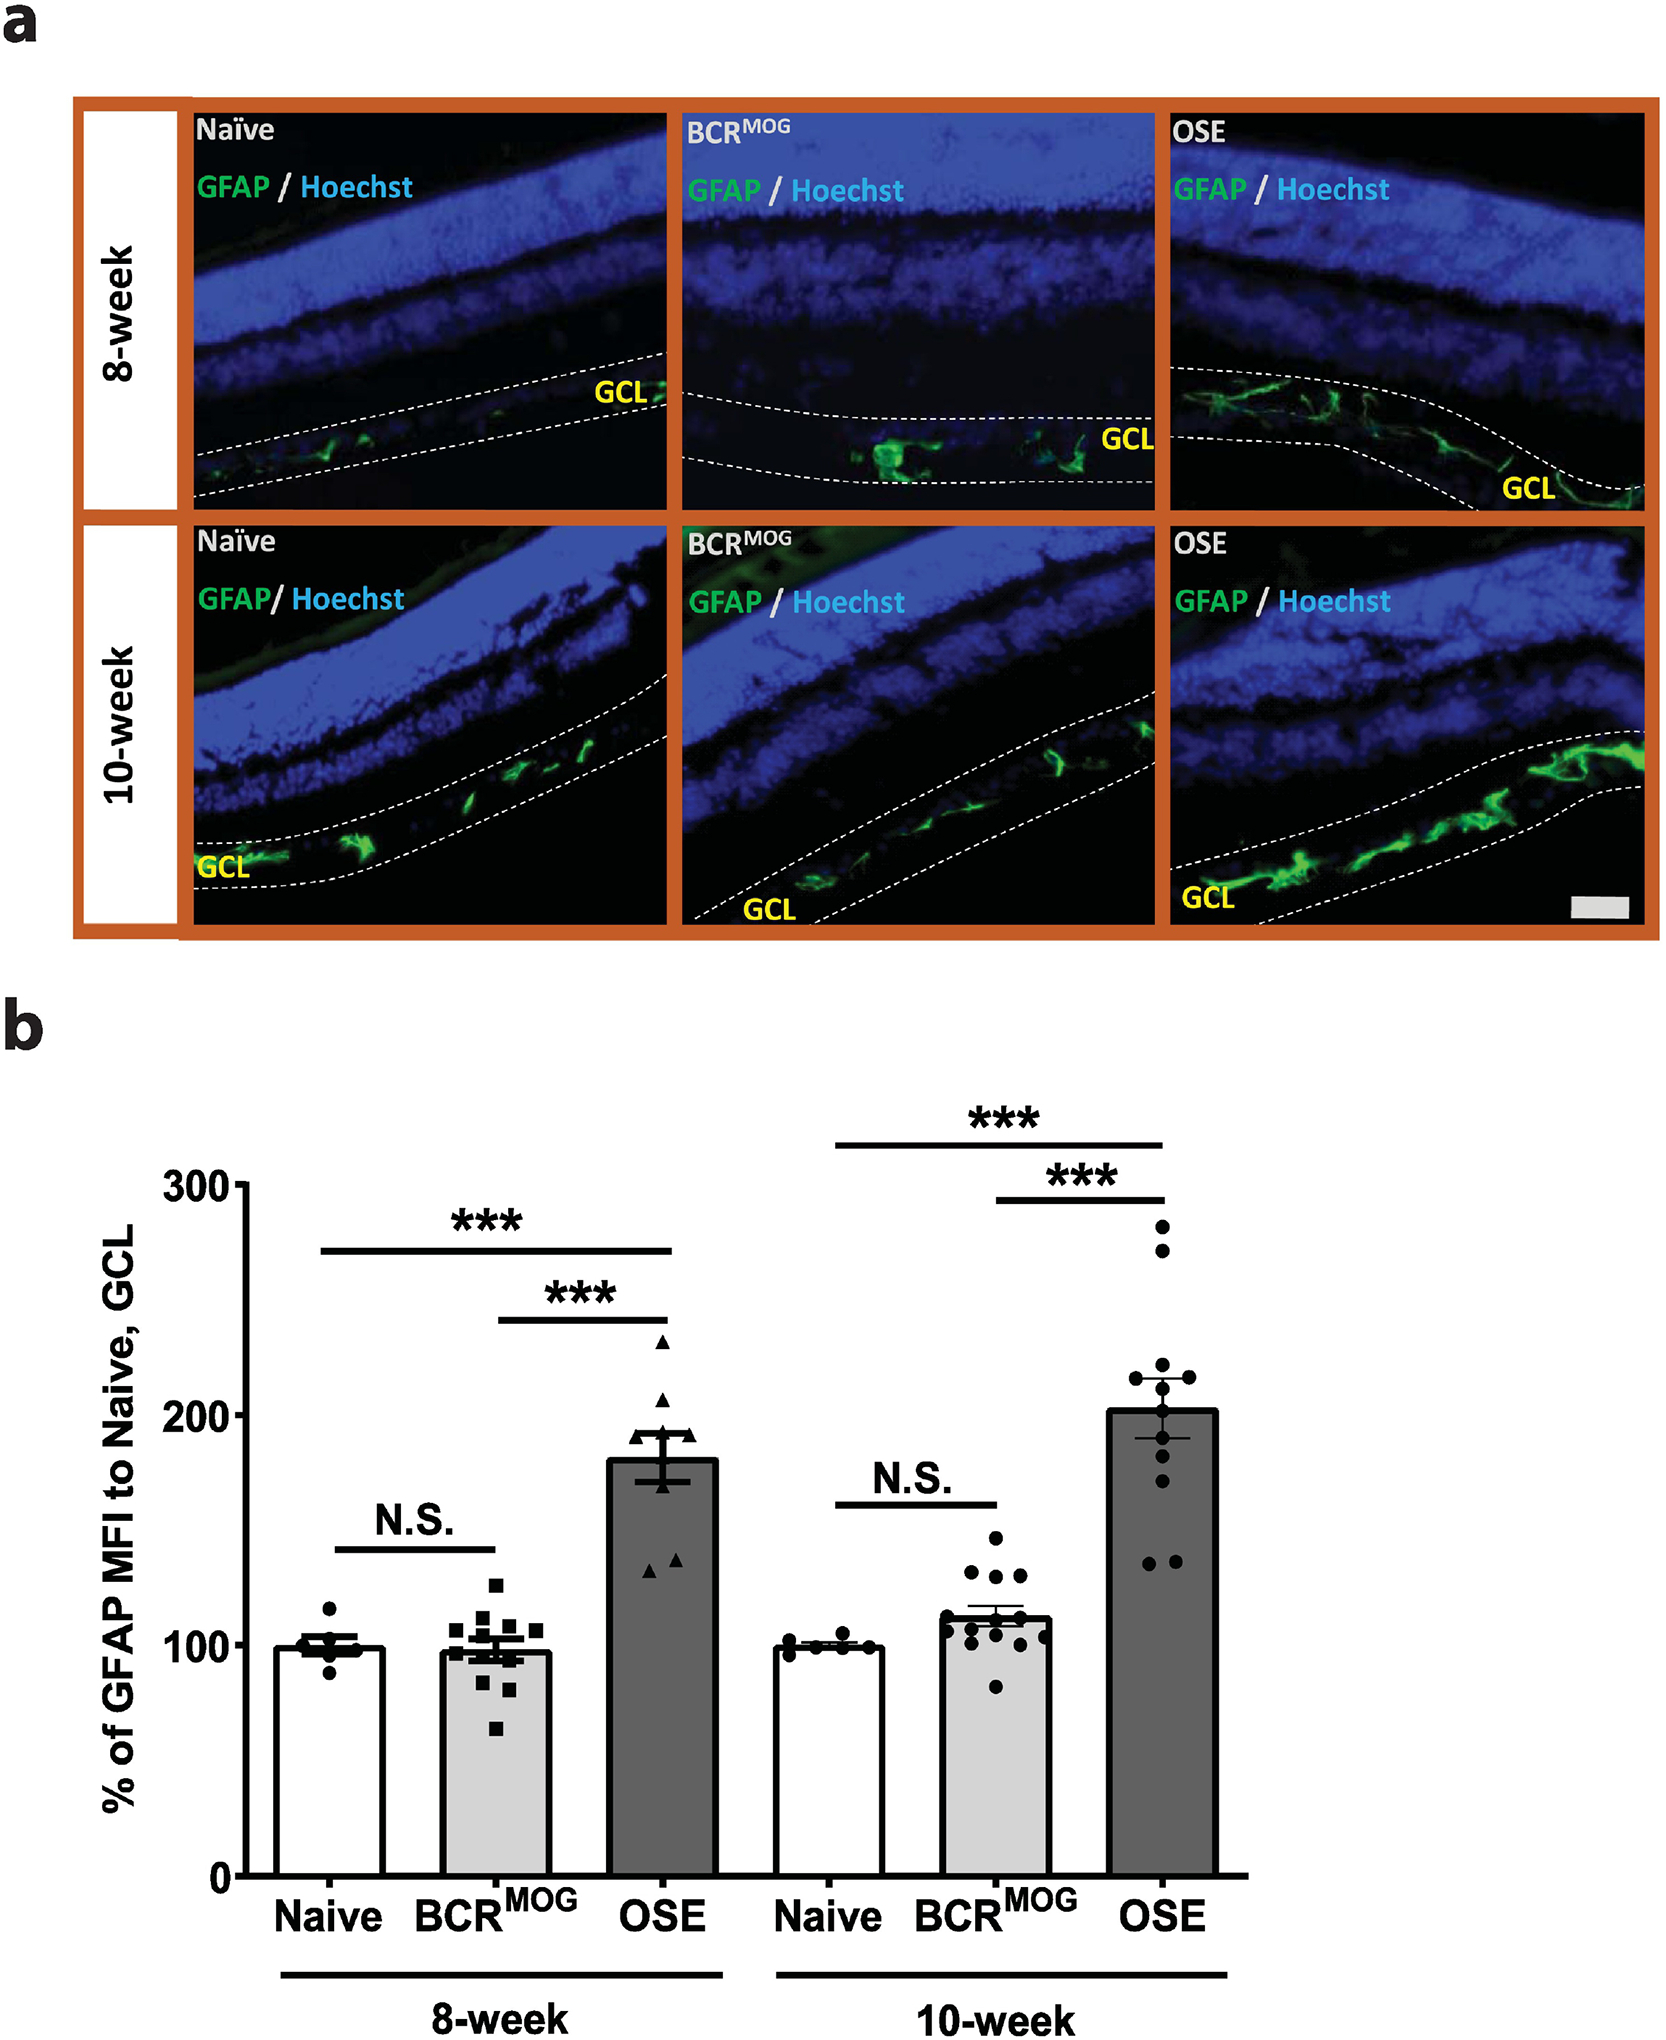
Figure 3. Activated astrocytes in the retina of OSE mice.

a) Representative images of astrocyte staining in the retina of OSE mice using anti-GFAP antibody. b) Quantification of GFAP expression in GCL layer of OSE mouse retina (F=32.25, p<0.0001. For 8-week: Naïve vs BCRMOG, P>0.9999; Naïve vs OSE, P<0.0001; BCRMOG vs OSE, P<0.0001. For 10-week: Naïve vs BCRMOG, P=0.9209; Naïve vs OSE, P<0.0001; BCRMOG vs OSE, P<0.0001). Each dot from bar graph represent one mouse. Significance of GFAP level between groups was assessed by One-way ANOVA (*** P ≤ 0.001, N.S. = no significance). Error bars represent SEM. Scale bar =50μm.
