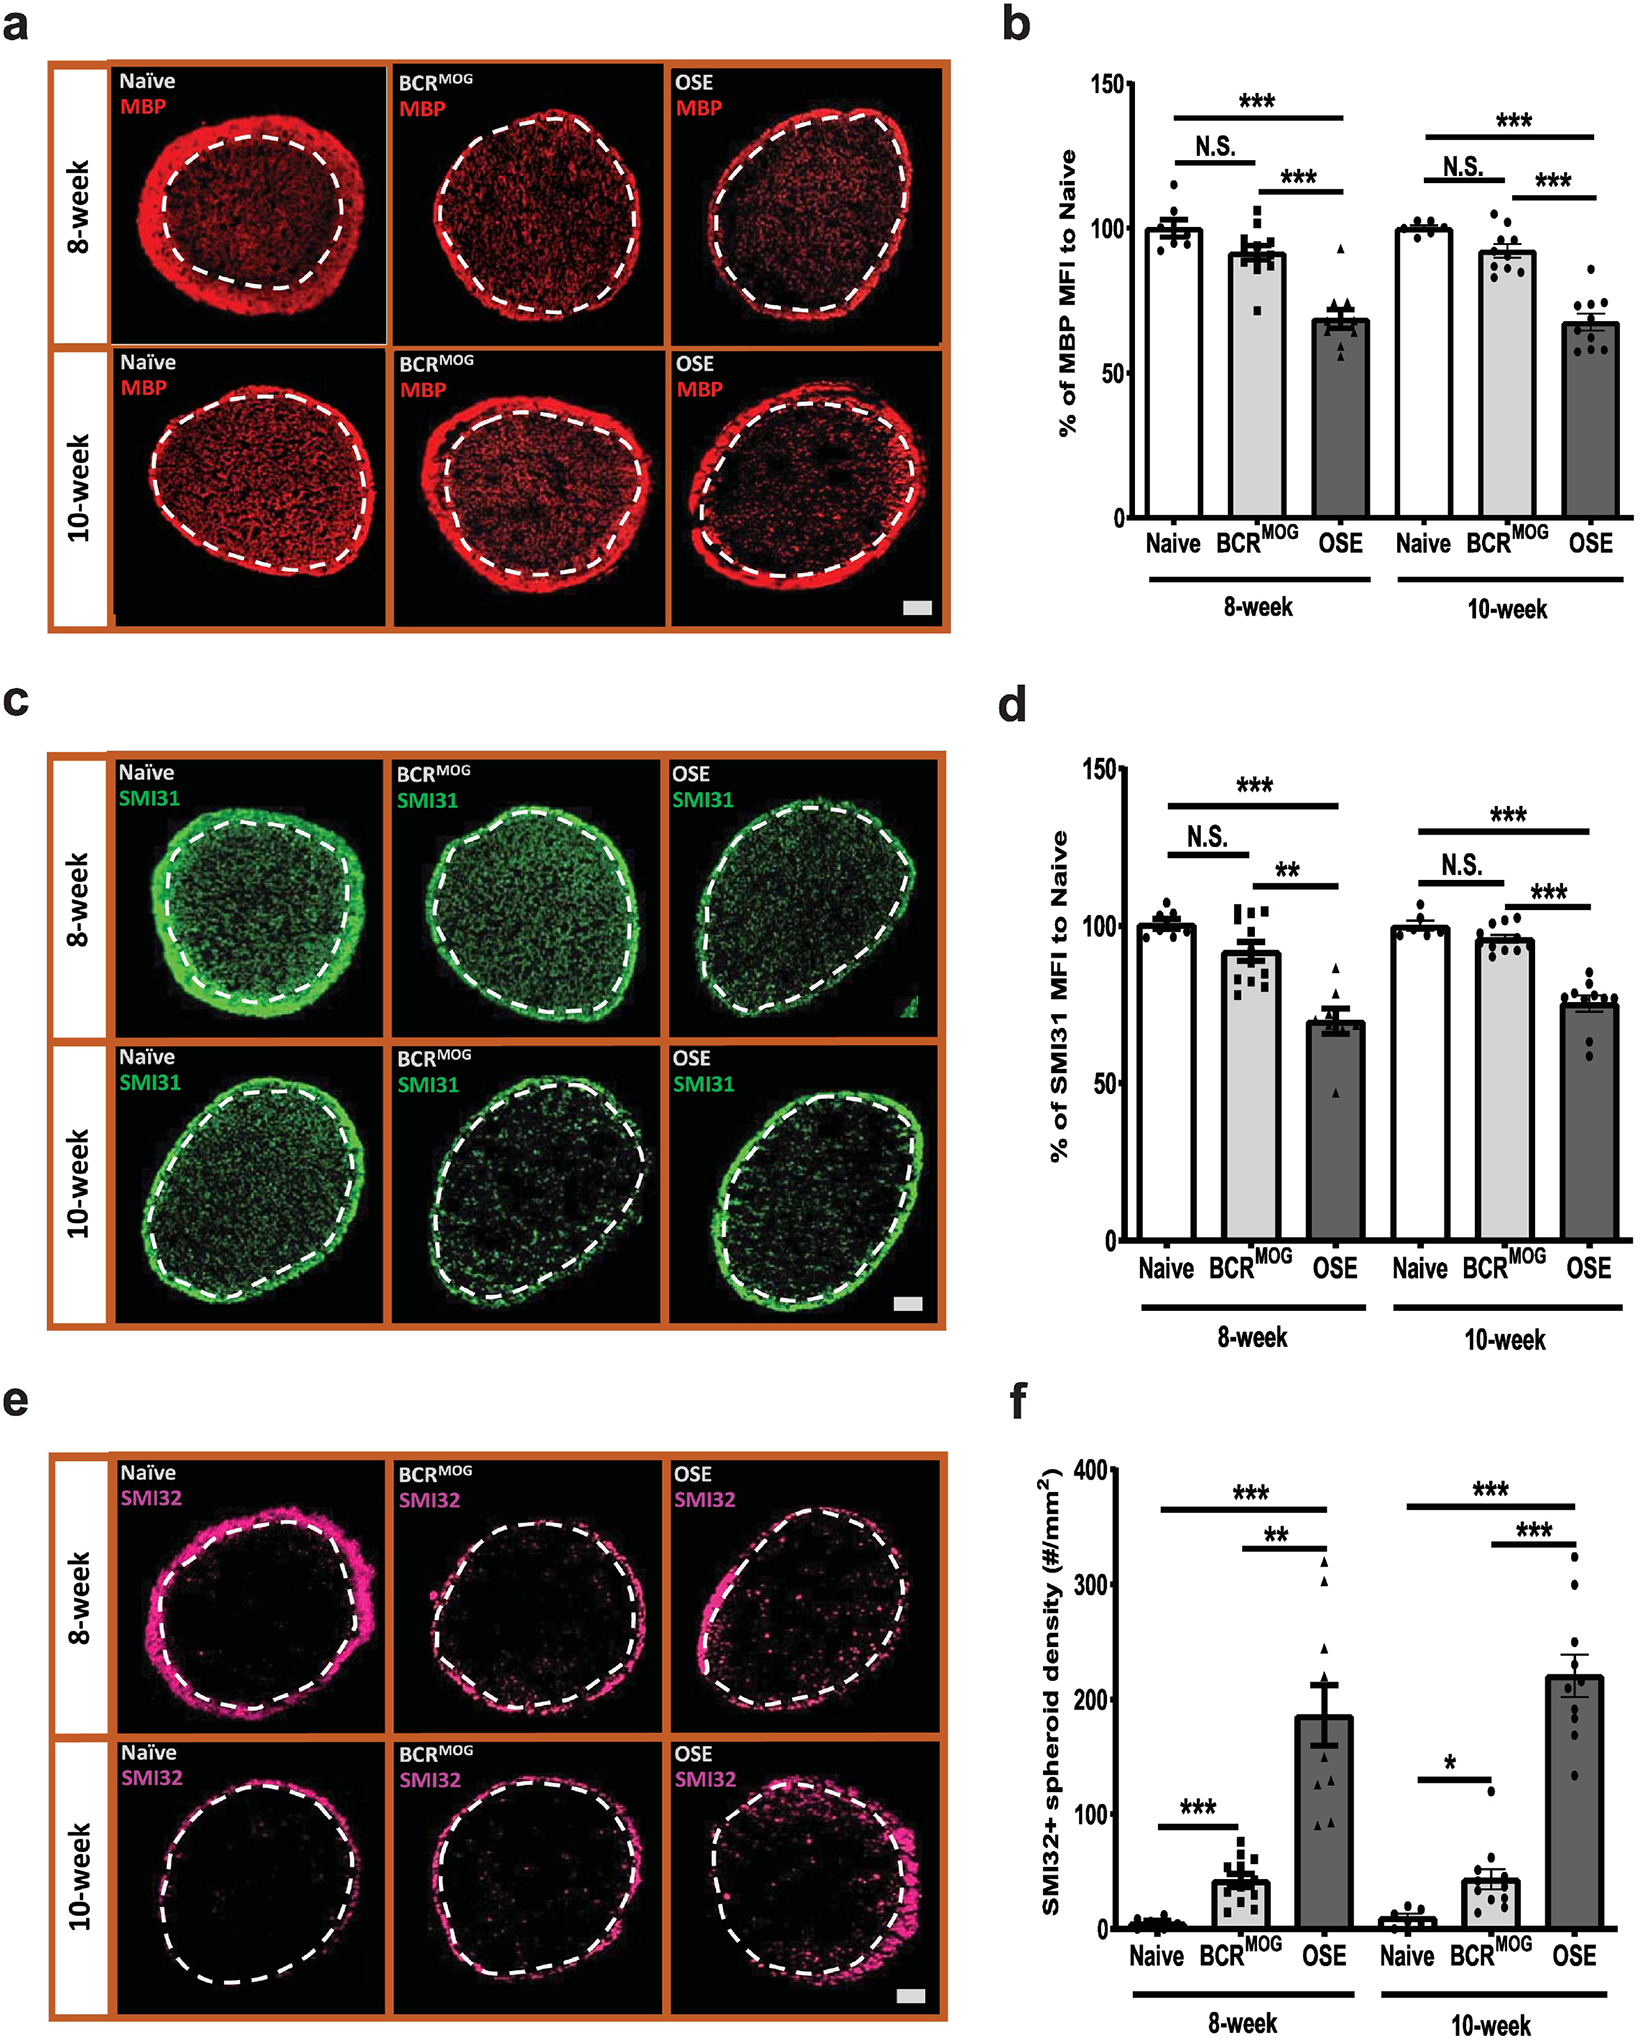
Figure 6. OSE mice had severe myelin loss and axonal damage.

Demyelination and axonal injury were evaluated by staining with MBP and neurofilament markers, SMI31 and SMI32. a) Represent images of MBP staining in the optic nerves of OSE mice. b) Quantification of MBP staining in the optic nerves of OSE mice (F=27.21, p<0.0001. For 8-week: Naïve vs BCRMOG, P=0.2956; Naïve vs OSE, P<0.0001; BCRMOG vs OSE, P<0.0001. For 10-week: Naïve vs BCRMOG, P=0.4768; Naïve vs OSE, P<0.0001; BCRMOG vs OSE, P<0.0001). c) Representative images of SMI31 staining in the optic nerves of OSE mice. d) Quantification of SMI31 staining in the optic nerves of OSE mice (F=22.48, p<0.0001. For 8-week: Naïve vs BCRMOG, P=0.2174; Naïve vs OSE, P<0.0001; BCRMOG vs OSE, P<0.0001. For 10-week: Naïve vs BCRMOG, P=0.9098; Naïve vs OSE, P<0.0001; BCRMOG vs OSE, P<0.0001). e). Representative images of SMI32 staining in the optic nerve of OSE mouse. f). Quantification of SMI32 staining in the optic nerves of OSE mice (F=36.68, p<0.0001. For 8-week: Naïve vs BCRMOG, P=0.6137; Naïve vs OSE, P<0.0001; BCRMOG vs OSE, P<0.0001. For 10-week: Naïve vs BCRMOG, P=0.7228; Naïve vs OSE, P<0.0001; BCRMOG vs OSE, P<0.0001). Each dot from bar graph represents one mouse. Significance between groups was assessed by one-way ANOVA (*** P ≤ 0.001, N.S. = no significance). Error bars represent SEM. Scale bar =50μm.
