

Abstract
Purpose
Acral melanoma is a rare subtype of melanoma that arises on the non-hair-bearing skin of the palms, soles and nail beds. In this study, we used single cell RNA-seq (scRNA-seq) to map the transcriptional landscape of acral melanoma and identify novel immunotherapeutic targets.
Experimental Design
We performed scRNA-seq on 9 clinical specimens (5 primary, 4 metastases) of acral melanoma. Detailed cell type curation was performed, the immune landscapes were mapped, and key results were validated by analysis of TCGA and single cell datasets. Cell-cell interactions were inferred and compared to those in non-acral cutaneous melanoma.
Results
Multiple phenotypic subsets of T cells, NK cells, B cells, macrophages, and dendritic cells with varying levels of activation/exhaustion were identified. A comparison between primary and metastatic acral melanoma identified gene signatures associated with changes in immune responses and metabolism. Acral melanoma was characterized by a lower overall immune infiltrate, fewer effector CD8 T cells and NK cells and a near-complete absence of γδ T cells compared to non-acral cutaneous melanomas. Immune cells associated with acral melanoma exhibited expression of multiple checkpoints including PD-1, LAG-3, CTLA-4, VISTA, TIGIT and the Adenosine A2A receptor (ADORA2). VISTA was expressed in 58.3% of myeloid cells and TIGIT was expressed in 22.3% of T/NK cells.
Conclusion
Acral melanoma has a suppressed immune environment compared to that of cutaneous melanoma from non-acral skin. Expression of multiple, therapeutically tractable immune checkpoints were observed, offering new options for clinical translation.
Keywords: melanoma, acral, microenvironment, single cell
Introduction
Acral melanoma is a rare subtype of melanoma (accounting for ~2–3% of all melanoma cases) that arises on the skin of the palms of the hands, soles of the feet, and nail beds (1,2). Unlike most cutaneous melanomas, which tend to arise more frequently in white populations, acral melanoma has a similar incidence across all population groups and is the most common form of melanoma in patients of Asian, African and Hispanic descent (2). Acral melanoma has a much lower mutational burden than non-acral cutaneous melanoma arising on sun-exposed skin. Additionally, it has a lower incidence of activating mutations in the two most common cutaneous melanoma oncogenes, BRAF (19%) and NRAS (21%), despite these being highly expressed in nevi arising on acral skin (3). Instead, acral melanoma has a higher frequency of mutations in c-KIT, NF1, NOTCH2, TYRP1 and PTEN and is characterized by genomic amplifications, rearrangements and copy number changes, particularly in genes such as CDK4, Cyclin D1, GAB2, PAK1 and TERT (4,5).
From a clinical standpoint, acral melanoma tends to present at a more advanced stage and has a worse prognosis than melanomas arising on non-acral skin (2). At this time acral melanoma is treated in a similar manner to melanomas arising elsewhere on the skin. With regards to targeted therapy, acral melanomas that harbor BRAF mutations show similar levels of response to BRAF and BRAF-MEK inhibition as other BRAF-mutant cutaneous melanomas. A recent report on a small cohort of Chinese BRAF-mutant acral melanoma patients demonstrated single agent vemurafenib to be associated with an overall response rate (ORR) of 61.5% with a median progression-free survival (PFS) of 5.4 months (6). In a study of Korean patients treated with either BRAF inhibitor monotherapy or BRAF-MEK inhibitor combinations, responses were reported in 79% of treated patients, with a median PFS of 9.2 months (7).
Responses to immunotherapies (such as anti-PD-1, anti-CTLA4 and the anti-PD-1/anti-CTLA4 combination) tend to be shorter in acral melanoma compared to those seen in patients with other cutaneous melanomas (7,8). A retrospective analysis of the efficacy of anti-PD-1 therapy in a small cohort of acral melanoma patients at US centers showed an ORR of 32% (8). Although this was analogous to the ORR reported for other cutaneous melanomas, the median PFS months was lower (4.1 versus 6–7 months). In a larger retrospective study of Japanese acral melanoma patients, the reported ORR to anti-PD-1 therapy was much lower (16.5%) (1). Studies have shown that acral melanoma has a lower frequency of PD-L1 expression (33% of cases were positive) compared to either mucosal (44% positive) or non-acral cutaneous melanoma (62% positive) (9). However, the composition of the immune landscape in acral melanoma patients remains poorly defined.
At this time, acral melanoma remains incompletely understood, and there has been little progress in developing strategies that are targeted to the unique biology of this disease. In the current study, we undertook a single-cell RNA-seq (scRNA-seq) analysis of clinical specimens of acral melanoma with the goal of better understanding the immune landscape of these tumors. Through these analyses and comparison with other cutaneous melanomas (from a previously published scRNA-seq analysis of melanoma skin metastases (10) and two publicly available non-acral melanoma single cell datasets (11,12)), we characterized the immune transcriptional landscape of acral melanoma identifying 1) important differences in the immune environments between acral and non-acral cutaneous melanoma and 2) potential novel targets for immunotherapy.
Materials and Methods
Patient Specimens
Nine human acral melanoma specimens from 8 patients were procured under a written informed consent protocol approved by the Institutional Review Board (IRB) of Moffitt Cancer Center (protocol number MCC# 50297). The study was conducted in accordance with recognized ethical guidelines of the Declaration of Helsinki, CIOMS, Belmont Report and U.S. Common Rule. Upon collection, samples were immediately placed on ice and transferred for processing. Samples were digested using Miltenyi Tissue Dissociation Kit (Bergisch Gladbach, Germany) and enriched for live cells using FACS sorting prior to quantification and loading. scRNA-Seq data from a previously published analysis (10) of a cohort of pre-treatment biopsies (n=5) of non-acral melanoma skin metastases from a phase I clinical trial of vemurafenib–cobimetinib–XL888 (NCT02721459) was used as a comparator.
Data availability statement
Raw FastQ and iscva.h5 files of scRNA-seq have been deposited in the NCBI SRA (NCBI, RRID:SCR_00647) database under SRA accession number PRJNA784961 and the GEO database under accession number GSE189889. Data are also available for analysis in ISCVA: iscva.moffitt.org
Whole-exome sequencing and mutational analysis
4 acral melanoma samples (AM3, AM4, AM7 and AM8-primary) were subjected to Moffitt-STAR clinical sequencing as part of routine clinical care. STAR NGS (STAR, RRID:SCR_004463) is a targeted DNA and RNA-based next-generation sequencing (NGS) assay based on the Illumina TruSight Tumor 170 platform (13). Whole-exome sequencing (WES) was performed to identify somatic mutations in the remaining 4 acral melanoma samples (AM1, AM2, AM5 and AM6). Following a quantitative-PCR-based DNA quality and quantity assessment using the Agilent NGS FFPE QC Kit, 200ng of DNA was used as input into the Agilent SureSelect XT Clinical Research Exome kit. Briefly, for each DNA sample, a genomic DNA library was constructed according to the manufacturer’s protocol and the size and quality of the library was evaluated using the Agilent BioAnalyzer (BioAnalyzer 2100, RRID:SCR_019715). An equimolar amount of library DNA was used for a whole-exome enrichment using the Agilent capture baits. After quantitative PCR library quantitation and QC analysis on the BioAnalyzer, approximately 130 million 75-base paired-end sequence reads per sample were generated using v2 chemistry on an Illumina NextSeq 500 sequencer. Sequence reads were aligned to the reference human genome with the Burrows-Wheeler Aligner (BWA RRID:SCR_010910) (14) and insertion/deletion realignment and quality score recalibration were performed with the Genome Analysis ToolKit (GATK RRID:SCR_001876) (15). Tumor specific mutations were identified with Strelka (Strelka, RRID:SCR_005109) and MuTect (MuTect, RRID:SCR_000559) (16), and were annotated to determine genic context (ie, non-synonymous, missense, splicing) using ANNOVAR (ANNOVAR, RRID:SCR_012821) (17). Additional contextual information was incorporated, including allele frequency in other studies such as 1000 Genomes (1000 Genomes Project and AWS, RRID:SCR_008801), the NHLBI Exome Sequence Project (NHLBI Exome Sequencing Project (ESP), RRID:SCR_012761), in silico function impact predictions, and observed impacts from databases like ClinVar (http://www.ncbi.nlm.nih.gov/clinvar/) (ClinVar, RRID:SCR_006169), and the Collection Of Somatic Mutations In Cancer (COSMIC, RRID:SCR_002260).
Single Cell RNA-seq
A single-cell suspension from each tissue was quantified and analyzed for viability using the Nexcelom Cellometer K2 and then loaded onto the 10X Genomics Chromium Single Cell Controller for single-cell RNA-sequencing library preparation (10X Genomics, Pleasanton, CA). Briefly, the single cells, reagents, and 10X Genomics gel beads were encapsulated into individual nanoliter-sized Gelbeads in Emulsion (GEMs) and then reverse transcription of poly-adenylated mRNA was performed inside each droplet. The cDNA was amplified and purified, and cDNA libraries were then prepared in bulk reactions using the 10X Chromium Single Cell 5’ Library Prep Kit (3’ Kit was utilized for sample AM1). Approximately 25,000 to 50,000 mean sequencing reads per cell were generated on the Illumina NextSeq 500 instrument using v2.5 flow cells. Demultiplexing, barcode processing, alignment, and gene counting were performed using the 10X Genomics CellRanger software (SCIGA, RRID:SCR_021002).
Quality Control and Cell Typing
A two-component computational tool ISCVA, Interactive Single Cell Visual Analytics (10), was used to perform scRNA-seq analyses, cell type classification, curation, and visualization. It consists of two major components. One includes the back-end scripts, functions utilizing R packages commonly utilized by single cell communities while the second component uses front-end JavaScripts to enable interactive investigation. Briefly, the R package, Seurat (SEURAT, RRID:SCR_007322), was used to process the aggregated 41,721-cell transcript count matrix generated from the 10X Cell Ranger pipeline. After filtering cells with >20% reads in mitochondria or with <200 features, and potential doublets, the remaining 36,208 cells were included in the analyses. We have de-batched the data using the find “anchors” approach in Seurat (18), which is one of three recommended methods for de-batching. In our scRNA-seq analysis the 10X Chromium Single-Cell 3′ Library Prep Kit was used for sample AM1’s preparation while the 5’ kit was used for the remaining 8 acral samples These differences corresponded to the batch information used in the de-batching process. Briefly, the expression of samples was normalized within each batch using SCTransform. Regularized negative binomial regression, along with a second linear regression against mitochondria read percentage as implemented in SCTransform, was used to adjust for cell-to-cell technical variations. Canonical correlation analysis (CCA) is performed to find anchors between different batches. The default 3,000 genes were kept for downstream analysis. To find a set of anchors between a list of 2 Seurat objects, we kept the default 30 as the number of dimensions to use in the anchor weighting procedure. These anchors can later be used to integrate the sample objects using Integrate Data function. A two-stage clustering was performed after de-batching. The first stage was for broad cell type identification while the second stage was for cell sub-population identification within lymphoid, myeloid, and melanoma cells respectively. The approach of the two-stage clustering and how the number clusters are selected for investigation are described in our previous work (10,19). Briefly, at each stage, we used the unsupervised clustering algorithms, Louvain at different clustering resolutions (with resolution parameters set at 0.6, 0.8, 1, 1.2, 2, and 4) and Infomap, in the principal component analysis (PCA) space to identify cell groups among all cells that passed QC. Followed by clusters generated at different resolutions as described above, we curated cell types against multiple reference panels provided in SingleR and other known signatures (10,20) and visualized them interactively through ISCVA. In addition, the R package, SingleR, was used to generate cell type candidates for each cell using multiple reference panels. The finest level of clusters, which we could align to currently known cell types, would be the number of clusters to be selected as the curated cell types in ISVCA. For some of the cell types, such as melanoma cells, there would be multiple clusters due to biological heterogeneity. For those, we merged these clusters from different curated cell types into a single “main category”. Each cell group (or main category) is then assigned a broad cell category based on the combination of SingleR predictions – mostly using the BlueprintEncode panel and followed by curation. In ISCVA, multiple resolutions of these clusters are available for visualization and future investigation. The second stage of clustering and curation mapped out the substructure of the myeloid and lymphoid cell populations. The myeloid cell analysis included all cells that fell under the categories of plasmacytoid dendritic cells (pDC) and macrophage/monocyte/DC, while the lymphoid analysis included all T and NK cells. The second stage analyses generated unsupervised clustering of the sub-populations of cells and then annotated these clusters according to their distinguishing gene expression, using published markers on myeloid and lymphoid cell subpopulations as a guide. Two small clusters of cells (of a total of 220 cells) with potential doublet signatures identified were further excluded from the analyses, resulting in a final 35,988 cells included in the analyses. To compare the cell population differences between acral primary tumors (N=5) and metastases (N=4), a Wilcoxon rank test was performed for each cell population of interests. No multiple comparison was adjusted. A nominal p-value of 0.05 was used to identified populations of interests.
InferCNV analysis
The InferCNV package, downloaded from BioConductor (infercnv, RRID:SCR_021140) was used to infer large-scale copy number variations (CNVs) from the raw gene expression data in the Seurat object. After cell type identification, non-melanoma cells were used as reference cells while the CNVs were inferred for the melanoma cells. The python script gtf_to_position_file.py, (https://github.com/broadinstitute/inferCNV/wiki/instructions-create-genome-position-file) (IPython, RRID:SCR_001658), was used to convert the GTF (GRCh38, used by CellRanger) to the Genomic Position File, as part of the input for InferCNV. The results indicated that all melanoma cells from each acral sample have chromosomal segments gains or deletions and were characteristics of malignant cells.
Cell-cell interaction analysis and acral-non-acral cutaneous melanoma comparisons
The cell population level differences between acral melanoma from this study were compared to previously published scRNA-seq data from non-acral melanoma skin metastases (10). Additional analyses were performed on two publicly available non-acral cutaneous melanoma scRNA-Seq datasets (11,12). Wilcoxon rank test was performed between acral (N=8: only the primary sample was included from the matched pair) and non-acral cutaneous samples (N=5), and boxplot was used for visualization. To identify any checkpoint or HLA-related genes of interest as potential targets, the proportion of cells with the expression of each gene was compared between acral and non-acral cutaneous samples using Wilcoxon rank for each of the major cell types, i.e., melanoma, myeloid and lymphoid cells. Since the sample size was small, this comparison was used as an initial screening step to identify potential subsets of checkpoints of interests. We then summarized the expression of each gene by cell type for each patient to understand the potential (personalized) therapeutic options. To investigate cell-cell interaction (CCI) mediated by ligand-receptor complexes, especially between NK cells and other subpopulations from single cell transcriptome data, SingleCellSignalR (21) was used. Briefly, SingleCellSignalR predicts ligand (L) and receptor (R) interactions between two cell types using a regularized LRscore based on their curated LR database which contains 3,251 ligand-receptor interactions. LRscore is a scaling product score of average ligand expression in one cell type and average receptor expression in the other cell type. When comparing CCI between acral and cutaneous samples, since the number of cells about 20-fold higher per sample in non-cutaneous acral cohort than the cutaneous melanoma samples, we down-sampled the number of cells in the acral samples to 1/20. This down-sampling ensured that the total number of cells per sample between these two groups were comparable before CCI inference was performed. The heatmap visualized the interactions with LRscore more than 0.5 (the missing LR scores were imputed as 0) between NK cells and other cell types in each sample and the average of number of interactions across the samples at each site. Wilcoxon test was performed to compare the number of interactions of paired cell types between two sites. In pairs of cells with statistically significant differences using the nominal p-value of 0.05 as threshold, we further investigated each specific interaction using Wilcoxon test. When comparing the CCI between the acral primary and metastasis samples, to maximize the information inferred from the data, the full dataset was used. No multiple comparison was adjusted considering small sample size. Nominal p-value of 0.05 was used to identified cells or interactions of interest.
Tumor heterogeneity analyses
A total of 19,547 melanoma cells from 9 acral samples were included in the tumor heterogeneity analyses. Shannnon index was calculated and compared between primary (N=5) and metastatic samples (N=4) using the SinCHET software developed by our group (22). The cluster and the related cluster biomarkers were determined using the Seurat R package (23). ShinyGO gene (ShinyGO, RRID:SCR_019213) ontology enrichment analysis was utilized to visualize top 50 markers associated with metastatic melanoma cells, prioritized based on proportions of cells differentially expressing each marker, p<0.05 (Column G, Supplemental Table 1). String (STRING, RRID:SCR_005223) was used for visualization of top 20 markers associated with Cluster 2 and Cluster 5 of melanoma cells, prioritized based on proportions of cells expressing each marker (Column I, Supplemental Table 2) (24).
TCGA validation
For in silico validation, TCGA bulk RNAseq data for acral (N=36) and cutaneous (N=443) were downloaded from cBioPortal (cBioPortal, RRID:SCR_014555). Cell type enrichment analysis for 64 cell types was performed using xCell, a robust signatures-based method for deconvolution (25). Because this approach uses ranked values within each dataset, which allows different cohorts or batches (from acral and non-acral) to be compared since absolute values are not used. A Wilcoxon rank test was conducted to compare the estimated scores associated with each cell population between cutaneous and acral melanoma samples.
Multiplex Immunofluorescent Staining
Human formalin-fixed, paraffin-embedded (FFPE) tissue samples were stained using the PerkinElmer OPAL TM Automation IHC kit (Waltham, MA) on the BOND RX autostainer (Leica Biosystems, Vista, CA) following the automated OPAL IHC procedure (PerkinElmer) with DAPI stain for nuclei (Akoya Biosciences, Menlo Park, California) and antibodies against CTLA4 (#ab 237712, Abcam, Cambridge, United Kingdom), VISTA (#54979S, Cell Signaling Technology Cat# 54979, RRID:AB_2799474) and ADORA2 (#LS-C805698, LSBio, Seattle, WA). Slides were imaged using the Vectra3 Automated Quantitative Pathology Imaging System. Multi-layer TIFF images were exported from InForm (PerkinElmer) (inForm, RRID:SCR_019155) and loaded into HALO (HALO, RRID:SCR_018350) for quantitative image analysis. The tissue was segmented into individual cells using the DAPI staining and a positivity threshold for each marker was determined based on published staining patterns (VISTA (26), CTLA4 (27), and ADORA2 (28)) and fluorescence intensity for that specific antibody.
Results
Acral melanoma specimens have a heterogeneous tumor microenvironment.
To interrogate the tumor microenvironment (TME) of acral melanoma at single-cell resolution, we performed droplet-based scRNA-seq on 9 surgical specimens from 8 patients. These were derived from 5 primary acral melanomas (AM2, AM3, AM4, AM6, AM8-primary) and 4 acral melanoma locoregional lymph node metastases (AM1, AM5, AM7, AM8-mets) (Supplemental Table 3). Two samples were from the same patient (AM8): a primary toe acral melanoma and lymph node metastasis. Since initial tissue collection, 4 patients experienced either disease recurrence or developed a new metastasis (Supplemental Table 3). Full clinical information and mutational status is shown in Supplemental Table 3. The only clinically relevant mutations identified were: AM4: NF1 mutation (L581Ffs*6), AM7: BRAF-V600E mutation and AM8: NF1 mutation (R1207*). Several variants of unknown significance were identified including KIT V339I and NRAS G115A in AM1 and BRAF L711V in AM6 (MAF files provided in Supplemental Material).
Visualization of subpopulations of cells and genes in t-distributed stochastic neighbor embedding (t-SNE) projections (Figure 1A), demonstrated the acral melanoma samples to consist of a diverse landscape of malignant and host cell types (Figure 1B). A total of 10 broad cell types (melanoma cells, macrophage/monocyte/DCs, T/NK cells, pDCs, fibroblasts, B cells, plasma cells, endothelial cells, hematopoietic stem cells [HSC] and other) were identified at this level (Figure 1C–E). Pooled analysis of all samples revealed the melanoma cells to be the most diverse population of cells and that most patients’ cells formed their own distinct clusters, whereas the stromal and immune cell subtypes from different patients tended to cluster together (Figures 1A–C). InferCNV analysis demonstrated that the cells identified as melanoma cells had patterns of amplification and deletion characteristic of malignant cells (Supplemental Figure 1). At the individual sample level, considerable variability was seen in the cell composition (Figures 1D–E, Supplemental Table 4, proportions of non-tumor cells in each sample are shown in Supplemental Figure 2). Of interest, some specimens (e.g., AM2, AM4) were characterized by a high degree of immune infiltrate, whereas others (e.g., AM3, AM6, AM7, AM8-primary) had a high proportion of tumor cells with much less immune infiltrate (Figure 1D–E). Analysis of the Hematoxylin & Eosin stained samples by our study pathologist revealed reasonable agreement between the cell type proportions identified by scRNA-seq and those seen by histological evaluation (Supplemental Figure 3). It should be noted that there are limitations in directly comparing results from highly quantitative scRNA-seq approaches and generally qualitative H&E pathology annotation in a quantitative manner. Additionally, the cells isolated for scRNA-seq come from a small area of the tumor, which may not represent the heterogeneity of the entire tumor.
Figure 1. Defining the cellular landscape of acral melanomas.
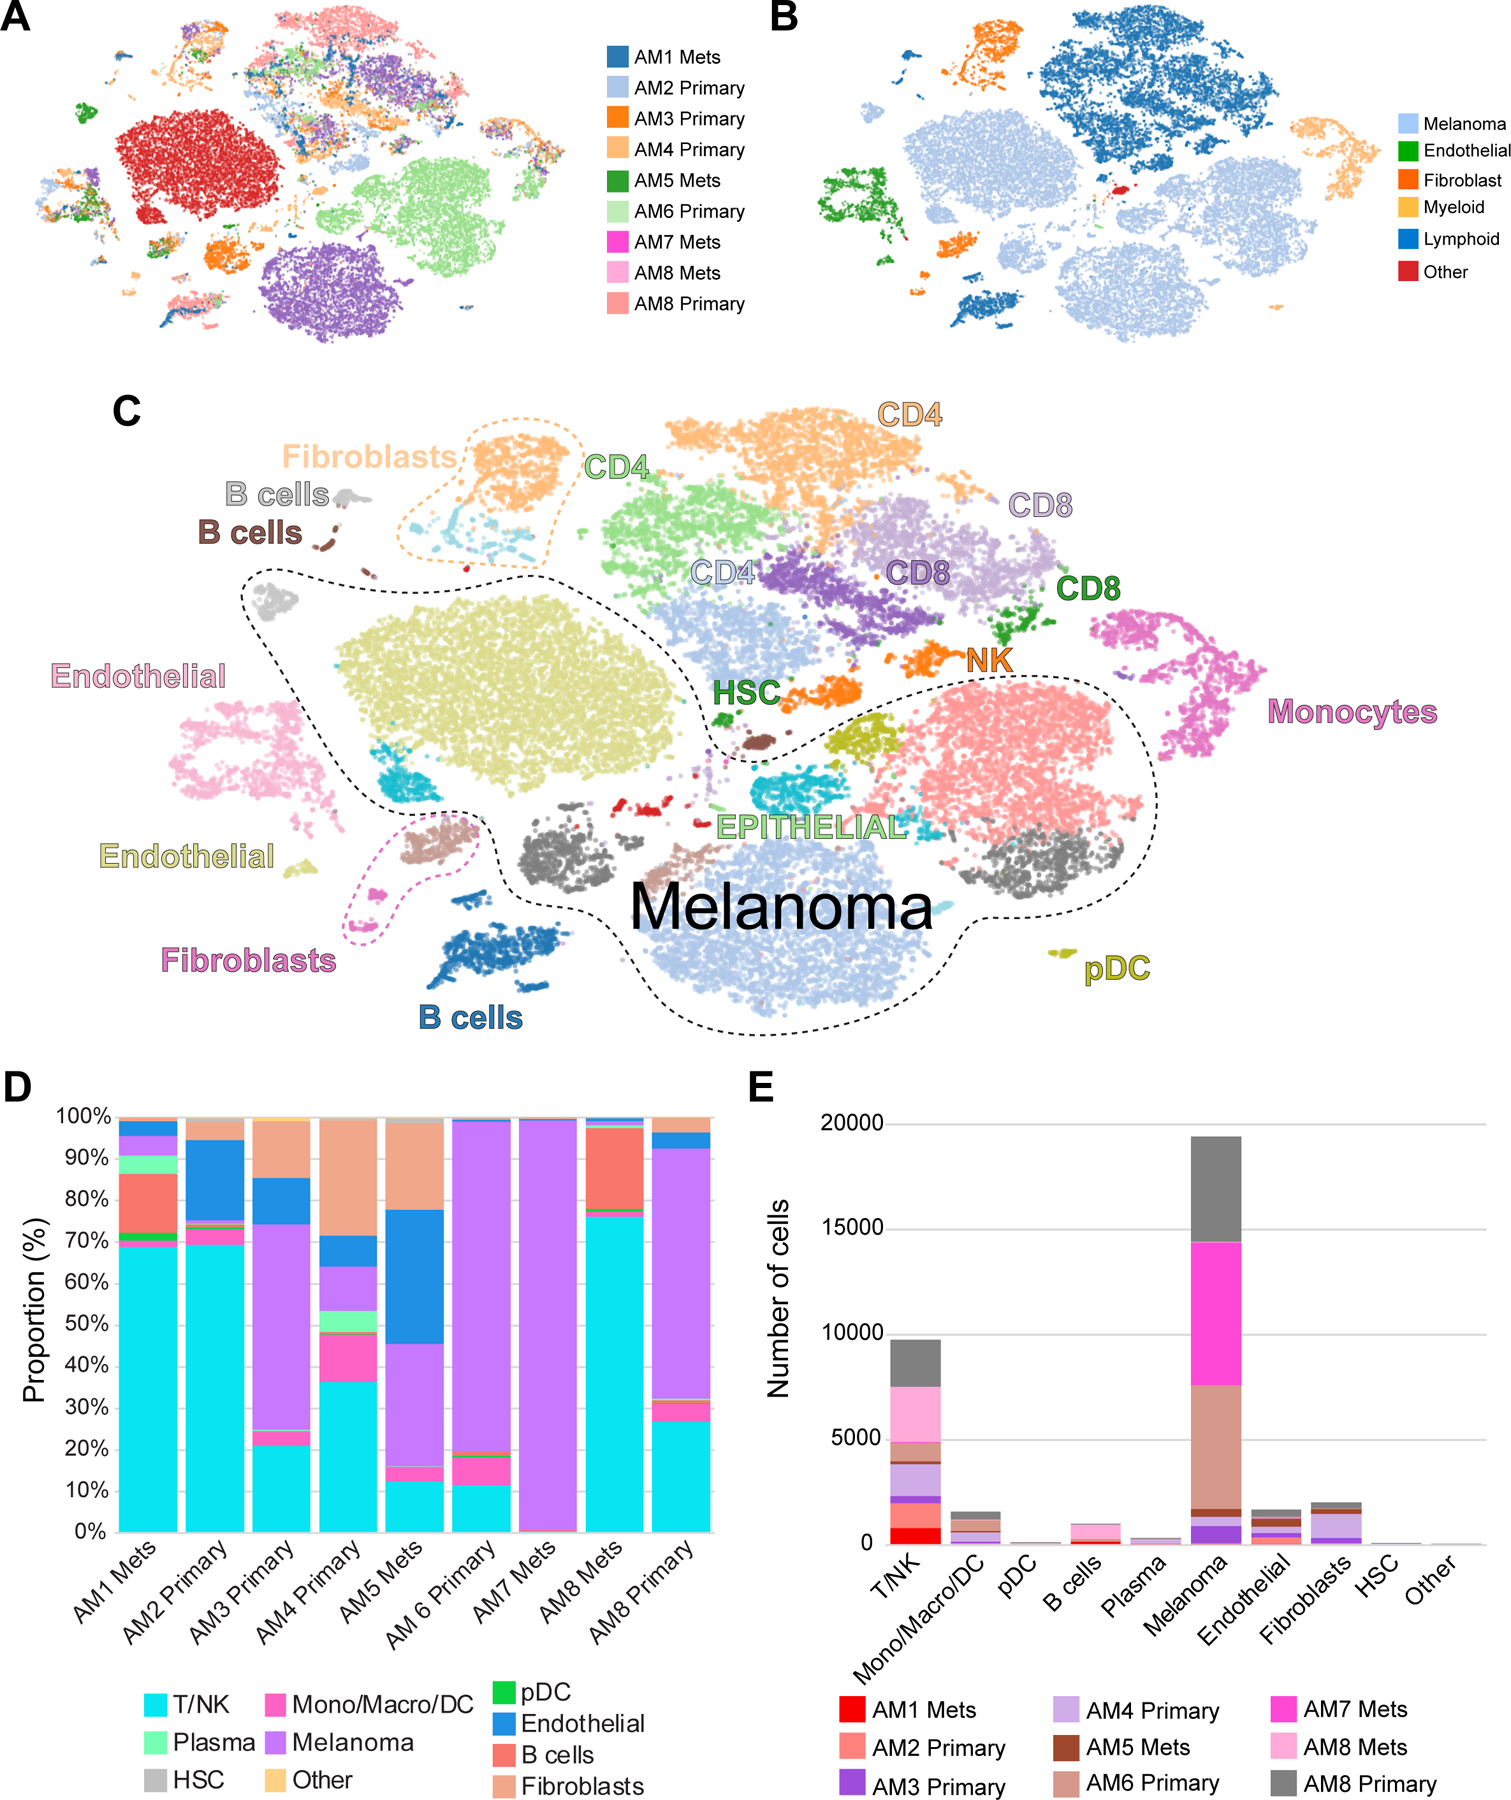
A, t-SNE plots showing cellular landscapes based on sample of origin. B, t-SNE plots showing cellular landscapes based on major cell types. C, t-SNE plots showing cellular landscapes based on detailed cell typing. D, Proportion of cells from major cell types identified from each sample. E, Number of cells from the major cell types identified in each sample.
The lymphocytic landscape of acral melanoma.
To better understand the landscape of lymphocytes in acral melanoma in finer detail, we applied a second stage of clustering and curation to map the substructure of the cell populations, including all of the T and NK cells (Figure 2A,B). A high-level overview of the lymphocyte population indicated distinct patterns of gene expression in terms of effector/cytotoxic markers (e.g., GZMB, IFNG) and checkpoint markers (PD-1, CTLA-4, TIM-3, LAG-3, etc.) (Figure 2C). A breakdown of the lymphocyte subsets revealed there to be a total of 18 subgroups, 9 sub-clusters of CD4 cells (with one cluster of CD4 regulatory T cells [Tregs] and one of T follicular helper cells [TFH]), 6 clusters of CD8 T cells (including effector memory T cells: [TEM] and tissue-resident memory T cells: [TRM], HSCs and two subgroups of NK cells (Supplemental Figure 4 and Supplemental Table 5 shows how gene expression differentiates each cluster, Supplemental Figure 5 shows lineage marker expression across clusters). To further determine the likely activation status of each identified T and NK cell subset, we next interrogated the data for known activation/exhaustion markers and assigned inferred activation states to each (Figure 2D, Supplemental Table 6). Among the major populations of T cells identified, the Clusters #1, 2 and 6 of T cells were judged to be naïve CD4 T cells, the Clusters #3 and #4 were activated but non-proliferating CD4 T cells and Clusters #7 and #8 were activated, proliferating CD4 T cells. Within the CD8 T cells, Cluster #10 and #11 were considered to be in an “early activation state”, cluster #12 was activated but non-proliferating (Figure 2D). CD8 T cell Cluster #13 was predicted to be a TEM cell phenotype and clusters #14 and #15 were CD8 TRM phenotypes. An analysis of the T cell profiles of each individual tumor demonstrated some, such as AM1, AM2, AM3, and AM4 to have increased proportions of exhausted T cell subsets, and to harbor the most Tregs (Figure 2E). It was additionally noted that acral melanomas harbored 3 sub-clusters of B cells and 2 of plasma cells (Supplemental Figure 6 and Supplemental Table 4). The highest proportion of B cells were found in AM1, AM4 and AM8-met. AM3, AM5 and AM7 had very low numbers of B cells (Supplemental Figure 6). As B cells were found both in the lymph node metastases and some primary tumors it is not possible to determine whether the B cells in the metastases were from the surrounding lymphatic tissue or the tumor microenvironment
Figure 2. The T and NK cell landscape of acral melanoma.
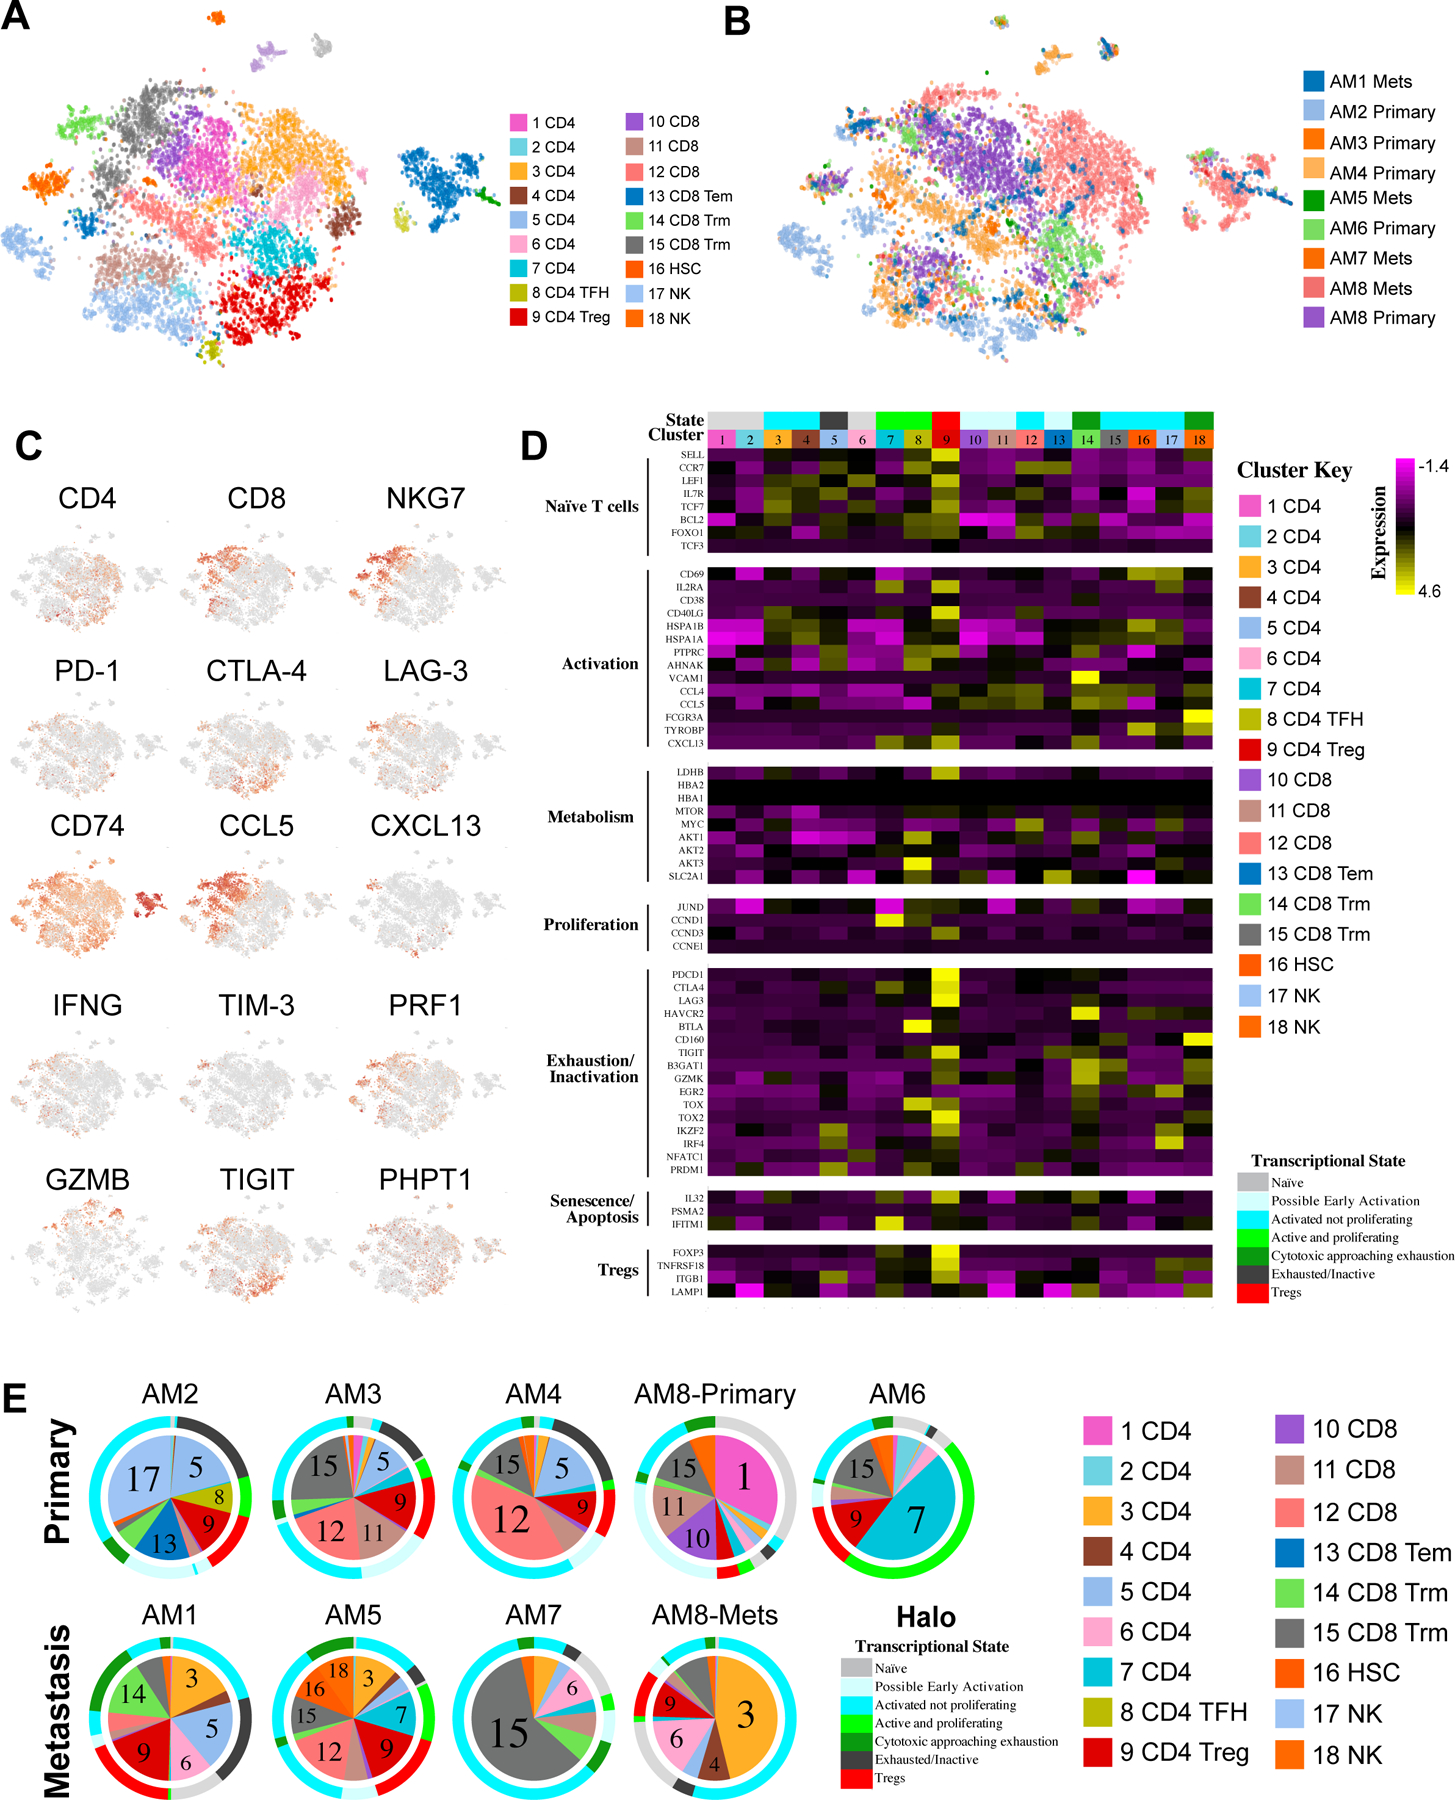
A, t-SNE analysis showing distribution of T and NK cell clusters across all samples. B, t-SNE analysis showing distribution of cells based on sample of origin. C, Expression of key T cell activation markers and immune checkpoints across all samples. D, Expression of T and NK cell markers associated with active/exhausted/proliferative transcriptional states across the subsets of T and NK cells. E, Pie charts show proportions of T and NK cell composition by sample. Colored halo indicates predicted activation/exhaustion/proliferative status of each T and NK cell sub-cluster based on gene-expression profiles across all samples.
The myeloid environment of acral melanoma.
We next turned our attention to the landscape of myeloid cells in acral melanoma and identified macrophages, monocytes, and dendritic cells (cDC1–2, DC3, pDC) (Supplemental Figure 7A,B). We then analyzed the myeloid cell populations for the key distinguishing markers (Supplemental Figure 7C and Supplemental Table 7, Supplemental Figure 5 shows lineage marker expression across clusters) and the entire landscape for expression of melanoma antigens and MHC genes (Supplemental Figure 7D). Most melanoma cells retained the expression of melanoma antigens (e.g., SOX10, MLANA, S100A1, etc.). Some melanoma clusters showed low expression of class I MHC (e.g., B2M, HLA-A, HLA-B, etc.). The majority of class II MHC was expressed in B cells and the myeloid cell populations (Supplemental Figure 7D). An analysis of the phenotypic breakdown of the myeloid cells by sample showed some to have macrophages as the major cluster (e.g., AM4, AM8-primary and AM7), whereas others were more characterized by high proportions of dendritic cells (e.g., AM2, AM3, AM5 and AM8-mets) (Supplemental Figure 7E).
Primary and metastatic acral melanomas have distinct transcriptional profiles.
We next determined the differences between primary and metastatic acral melanomas (Figure 3A). Most of the metastatic samples were from lymph nodes and, as expected, contained more B cells and CD4 T cells and fewer endothelial cells and fibroblasts than the primary lesions (Figure 3A). A higher proportion of myeloid cells (macrophages, monocytes and dendritic cells) were observed in primary samples than metastatic samples (p = 0.014) while no major differences found between other cell types. A more in-depth analysis of the lymphocyte compartment of matched primary and metastatic samples from the same individual (AM8) was performed (Supplemental Figure 8A–B). It was noted that the primary had multiple subsets of CD8 T cells, NK cells and TFH CD4 cells. By contrast, the lymph node metastasis contained far fewer CD8 T cells, NK cells, monocytes and macrophages and showed increased infiltration of two subsets of CD4 T cells and B cells, pDCs and cDC2s (Supplemental Figure 8C,D). Preclinical studies have shown melanomas to be composed of cells with different transcriptional states that interact to drive tumor progression and drug resistance (29,30). We utilized the Seurat clusters of melanoma cells, defining 16 transcriptional states with unique gene signatures (Figures 3B, Supplemental Table 2). We investigated whether acral melanomas (with their lower mutational burdens) showed a similar degree of heterogeneity and how the transcriptional make-up differed between primary and metastatic acral melanomas (Figure 3C). It was noted that some transcriptional clusters were shared across specimens (Supplemental Table 4). Among these Cluster #1 (enriched for genes involved in telomere maintenance) was found in AM2 and AM6, Cluster #5 (suppression of genes involved in mitochondrial transport/respiration) was identified in AM1, AM2, AM3, AM5 AM6 and AM7, Cluster #6 (development and cytoskeletal remodeling) was in AM2, AM3 and AM4 and Cluster #8 (suppressed WNT signaling and apoptosis induction) was in AM2 and AM6 (Figure 3C and Supplemental Table 2). These groups of tumor cells may exhibit differences in immune recognition, because some clusters (e.g., #8) had higher expression of MHC class II molecules, whereas clusters #0, 5, 6, 9 and 15 had reduced expression of Class I MHC (Supplemental Figure 9). We next investigated the relationships of the 16 acral melanoma clusters with respected to previously reported transcriptional states (e.g. MITF and AXL gene signatures (11) and the 7 signatures (ranging from Undifferentiated to Melanocytic), as described in (31) (Supplemental Figure 10). We then performed PCA analysis of expression levels of genes within each of the 9 signatures as listed in Supplemental Table 8. The PC1 scores were used to summarize each signature and visualized across 16 clusters using boxplots. We observed the PC1 scores of Neural crest-like signature in Cluster #2 and Cluster #12 (Supplemental Figure 10A). In addition, we observed the transitory stage in Cluster #11 and Cluster #14 which were primarily found in AM5 and AM1 (Supplemental Figure 10B). The loadings for each gene were summarized in Supplemental Table 8. For instance, the genes in the neural crest signature with high (negative) PC1 loadings such as SFRP1, CADM3, PHLDA2, and NES are higher expressed in Clusters #2 and #12 (Supplemental Figure 10C) while the genes in the transitory signature with higher PC1 loading such as RNASE1, ALDH1A1 and FXYD3 are higher expressed in Cluster #11 (Supplemental Figure 10D).
Figure 3. Tumor cell heterogeneity in acral and cutaneous melanomas.
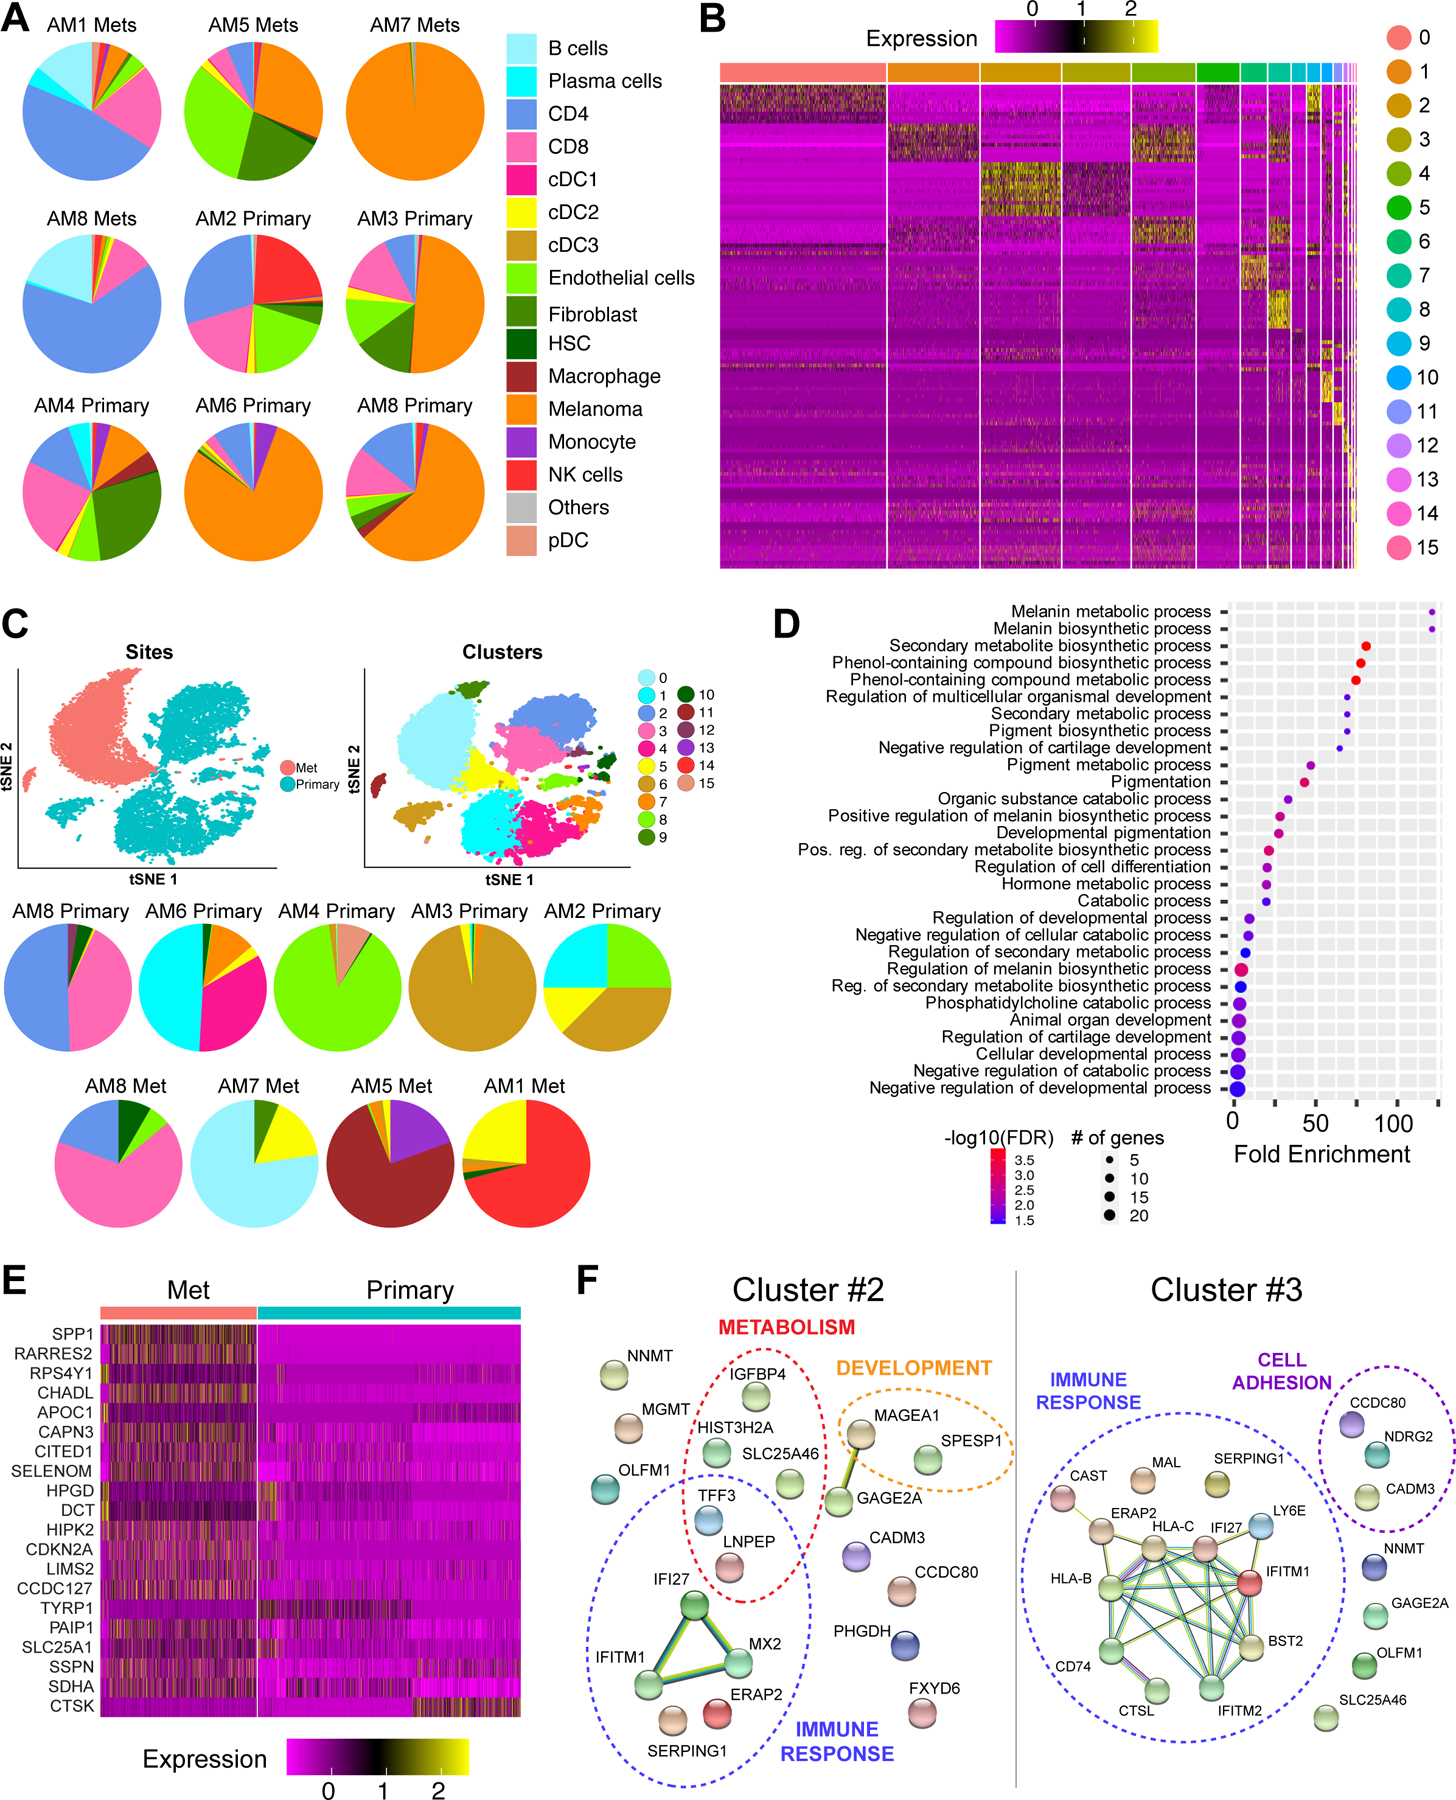
A, Pie charts show proportions of major cell subpopulations in each primary and metastatic sample. B, Unsupervised clustering identified 16 clusters of melanoma cells across all acral melanoma samples based on gene-expression profiles. C, t-SNE analysis (top) and pie charts (bottom) show melanoma heterogeneity across primary and metastatic samples. D, ShinyGO Gene Ontology enrichment analysis of genes differentially expressed between primary and metastatic acral melanoma samples, showing the major functional pathways affected. E, Heatmap shows genes differentially expressed in melanoma cells between primary and metastatic acral cutaneous melanoma samples. F, String analysis of top 20 differentially expressed genes associated with cluster 2 and cluster 5 of melanoma cells (ranked based on differential expression and proportion of cells expressing each marker). Each sphere represents a protein product of each gene marker and the lines represent known interactions among the protein products of each gene. Dotted lines group markers with known roles in similar biological processes.
A detailed comparison of the primary and metastasis samples revealed altered expression of genes implicated in melanin synthesis/metabolism, metabolic regulation and developmental programs (Figure 3D,E). Among these increased in the metastases was the transcriptional regulator CITED1, a CBP/EP300 interacting gene known to regulate MITF expression in cutaneous melanoma (32,33) (Figure 3E). Other genes noted to be higher in the acral melanoma metastases included those implicated in the cell cycle (CDKN2A), the immune response (CTSK, RARRES2) and metabolism (APOC1, SDHA) (Figure 3E).
To study the heterogeneity in a more controlled setting, we next compared the transcriptional profiles of the tumor cells from the matched primary and lymph node metastasis samples from AM8. InferCNV analysis confirmed that the AM8-primary and AM8 met samples showed similar patterns of gains and loss (Supplemental Figure 11). These analyses revealed the primary melanoma to be split between 2 major sub-clusters (#2 and #3) and the metastasis to be dominated by sub-cluster #3 (Figure 3C). It was noted that the metastasis sample had fewer cells in sub-cluster #2, which had higher expression of genes involved in interferon responses (IFITM1, IFI27, MX2) and metabolism (IGFBP4, SLC25A46) (Figure 3B,F). Instead, the lymph node metastasis was enriched for cell-cell adhesion genes including CADM3, NDRG2 and CCD80 (involved in adhesion and regulation of WNT signaling) and multiple immune regulatory genes including HLA-A, HLA-C and multiple mediators of the interferon response. Together, these results imply a role for altered metabolism and changes in expression of immune modulatory molecules in the development of metastatic acral melanoma.
The immune microenvironment of acral melanoma is characterized by reduced immune infiltrate, less NK cells and γδ T cells.
Although acral melanoma is considered less responsive to immune checkpoint inhibitor therapy than melanoma arising on non-acral skin, little is known about how the immune environments of these two melanoma subtypes differ. To address this, we compared the immune landscapes of from scRNA-seq data from 5 non-acral cutaneous melanoma metastases previously analyzed by our group (10) and two previously published non-acral melanoma datasets (GSE115978 and GSE72056 (11,12)) to our acral melanoma specimens (Figure 4A,B and Supplemental Figure 12). A statistical analysis demonstrated the acral melanomas to have significantly fewer pDC, CD8 T effector memory cells and NK cells, and very few γδ T cells (Figure 4B,C and Supplemental Figure 13). We then compared the extent of immune infiltrate in our acral and non-acral melanoma samples to two previously published non-acral melanoma single cell datasets (GSE115978 and GSE72056) (11,12). It was noted that the levels of immune infiltrate were similar across all three non-acral melanoma datasets, and that these were significantly higher than those in our acral samples (Figure 4D). The mean level of immune infiltrate for acral melanoma was 39.1% (95% CI: 13.1–65.1%) and was much higher for non-acral melanoma samples from our previous study [66.6% (95% CI: 33.5–99.7%); N=5] (10). The other non-acral cutaneous scRNA-seq datasets had similar findings as our non-acral melanoma samples [71.2% of immune infiltrate (95% CI: 61.8–80.7%) for GSE115978 (N=32), and 67.6% (95% CI: 51.9–83.3%) for GSE72056 (N=19)].
Figure 4. Comparing immune landscapes between acral and non-acral cutaneous melanoma.
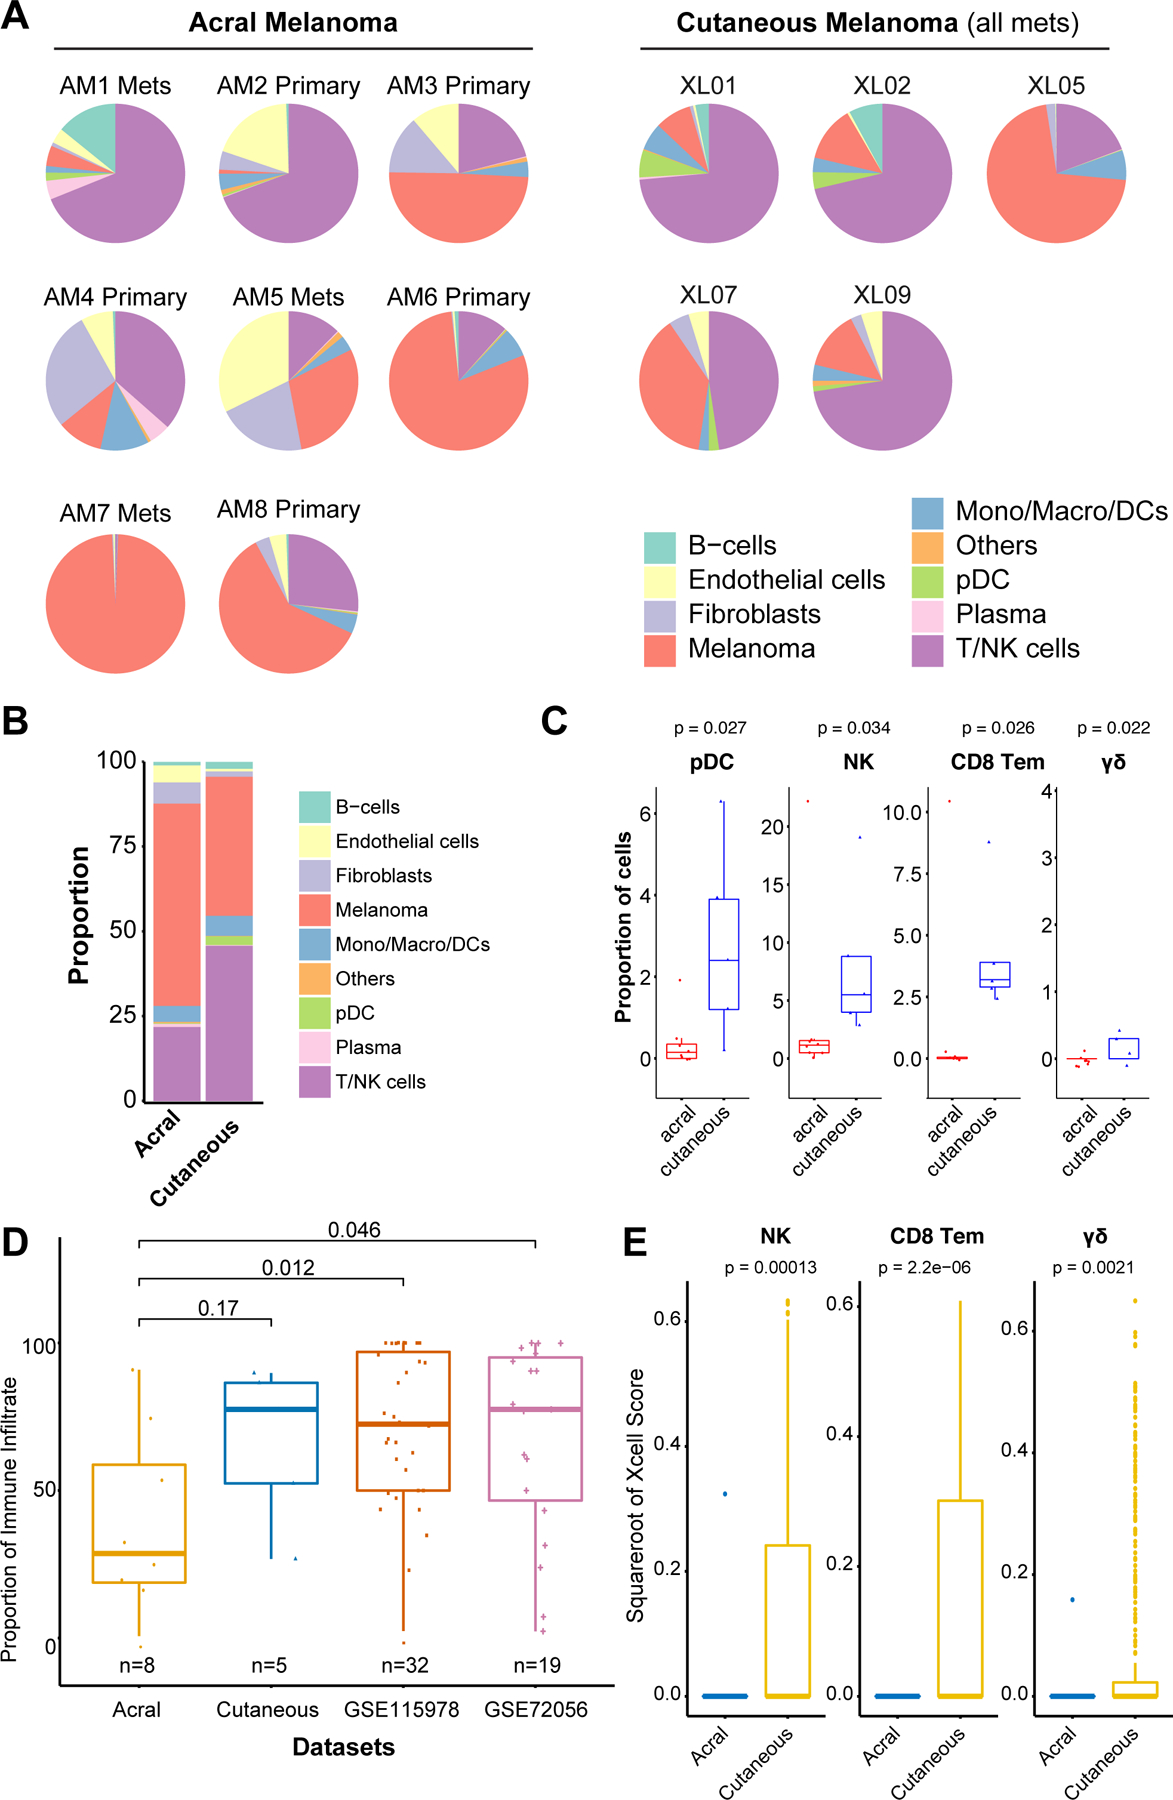
A, Pie charts show proportions of major immune cell subpopulations in individual acral and cutaneous melanoma samples. B, The average proportion of the major immune cell subpopulations in acral and non-acral cutaneous melanoma sample cohorts. C, Boxplots showing proportion of immune cell subpopulations which are differentially represented between acral and non-acral cutaneous melanoma sample cohorts (Wilcoxon test). D, Heatmap of normalized xCell Scores from analysis of acral and non-acral cutaneous melanoma specimens in the TCGA dataset. F, Boxplots showing proportion of γδ T cells, NK cells and CD8 T effector memory cells in acral and non-acral cutaneous melanoma specimens in the TCGA dataset (Wilcoxon test).
To further validate our findings in a larger cohort of samples, we interrogated the TCGA datasets for non-acral cutaneous melanoma (N=443) and acral melanoma (N=36) to map immune cell gene signatures in each tumor bulk sample (Figure 4E). Cell type enrichment was estimated using xCell. This analysis also revealed lower proportion of CD8 T effector memory cells, NK cells and γδ T cells in the acral samples compared to the non-acral cutaneous (Figure 4E). Levels of pDCs between the two sample sets did not show a significant difference in the TCGA dataset.
As loss of MHC expression can affect immune recognition, we next looked at expression of MHC genes and noted similar levels of MHC class I expression between acral and non-acral cutaneous melanomas. Some acral melanoma samples had reduced MHC expression, e.g. HLA-B in AM3 and AM7 and B2M in AM3 (Supplemental Figure 14). Of note, both AM3 and AM7 had a high proportion of tumor cells compared to immune infiltrate (Figure 1D).
Acral melanoma and cutaneous melanoma have different patterns of cell-cell communication in the immune microenvironment.
To better understand the nature of the immune landscape of acral melanoma, we performed cell-cell interaction analysis using SingleCellSignalR (21). This method, which maps expression of ligand-receptor pairs between different tumor and host immune cells in the TME, allows potential cell-cell interactions to be inferred. As the total number of cells was less in the non-acral samples, we downsampled the acral data so that the number of cells per sample in two sample types were equivalent. Across samples, several trends were noted. The non-acral cutaneous melanoma cells showed increased communication (i.e., immune cell->tumor) with CD4 T cells, CD8 T cells, cDC2 cells, NK cells, monocytes, macrophages, fibroblasts and endothelial cells; especially with NK cells and cDC2 cells (p = 0.01 and 0.045, respectively) compared to the acral melanoma cells. (Figure 5A,B and Supplemental Table 9). An equivalent cell-cell interaction analysis was also performed across the publicly available scRNA-seq datasets and is shown in Supplemental Figure 15.
Figure 5. Cell-cell interactions in cutaneous acral and non-acral melanomas.
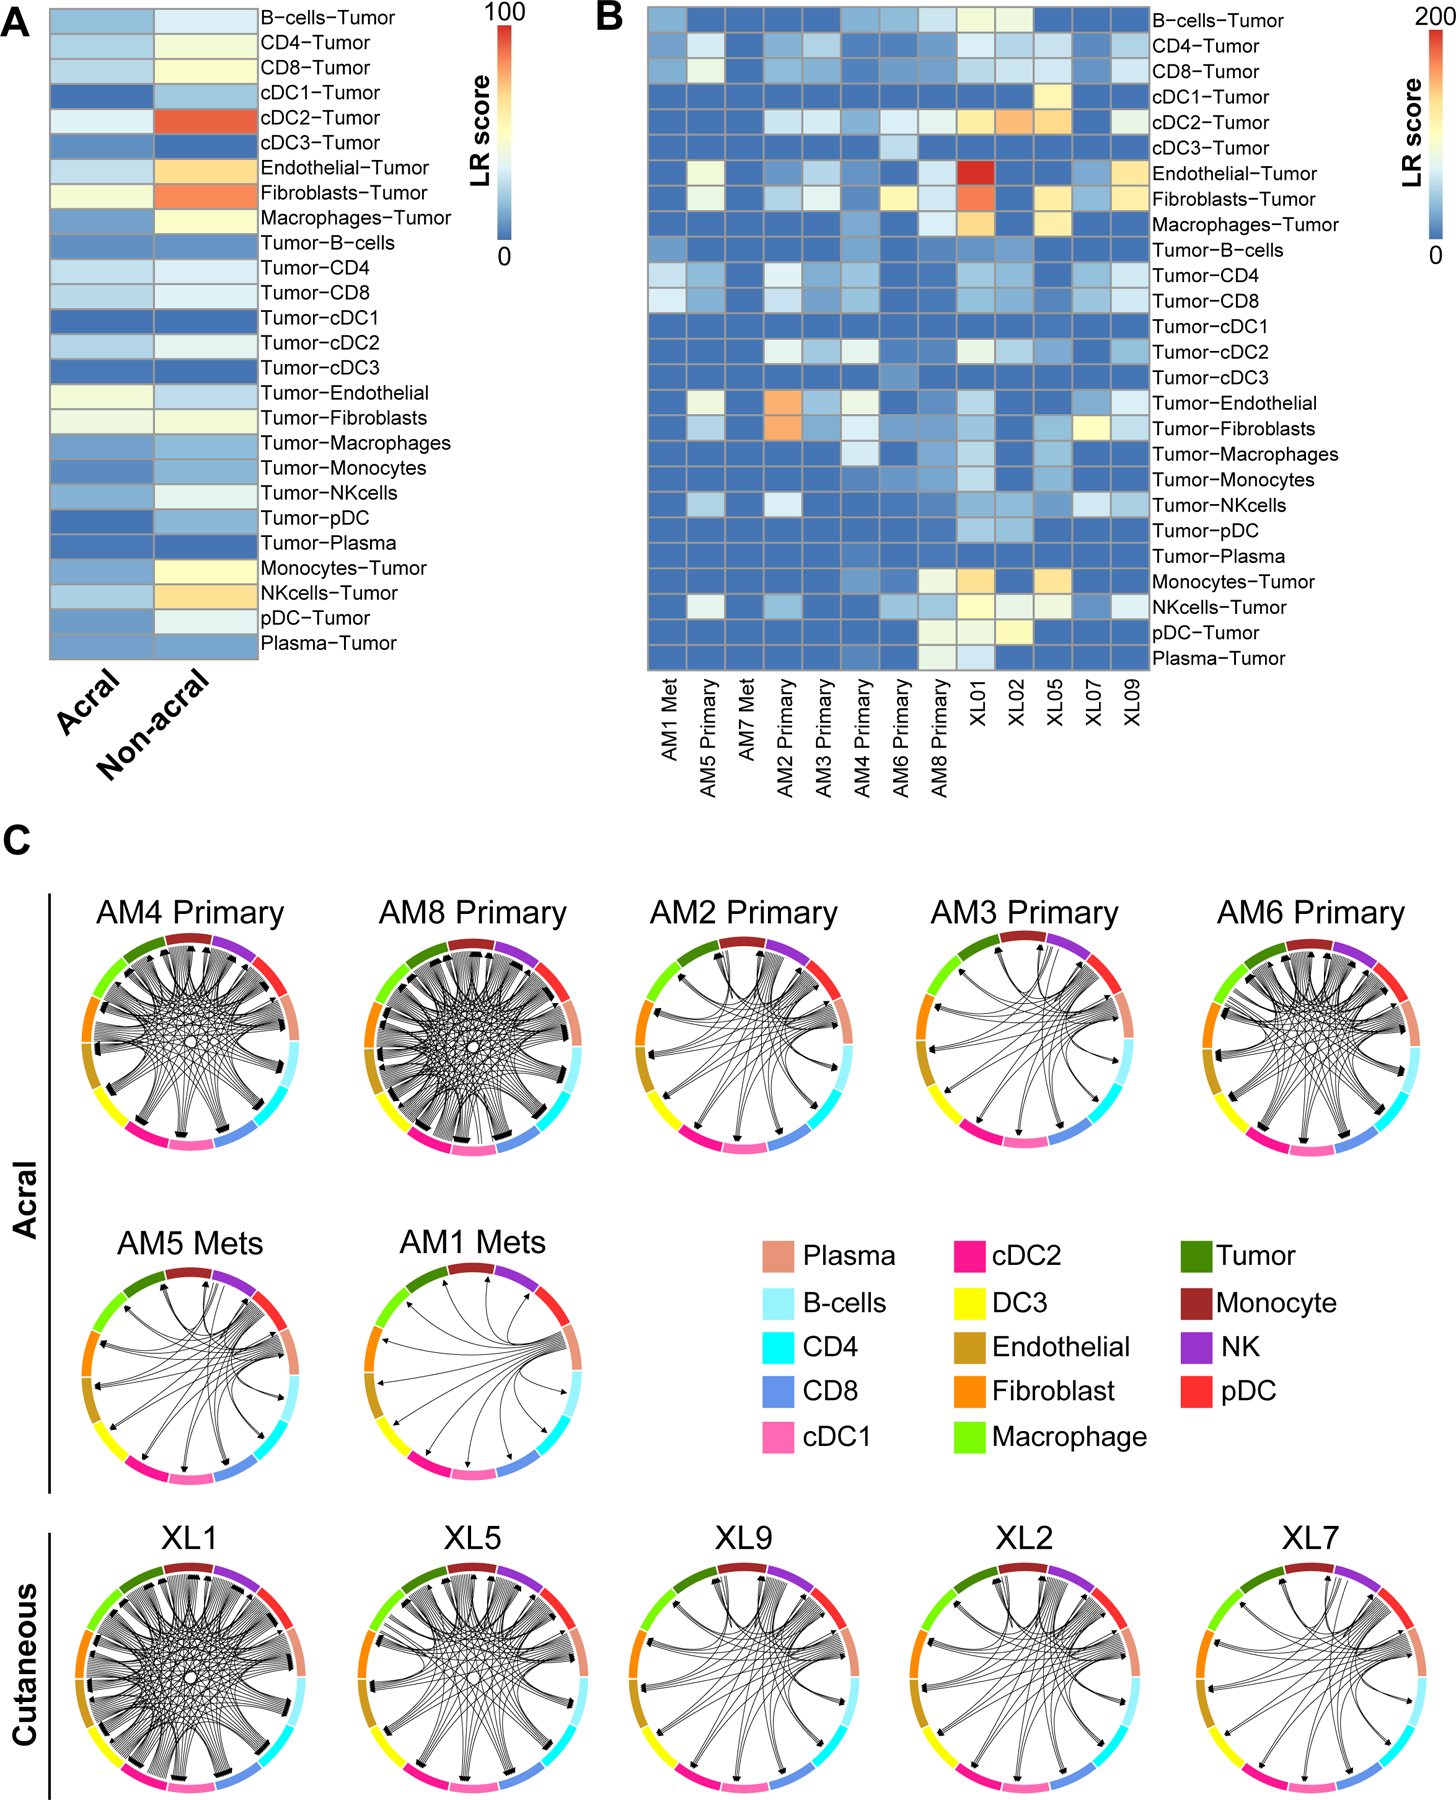
A, Heatmap showing the mean LR scores from SingleCellSignalR cell-cell interaction analysis of acral and non-acral cutaneous melanoma specimens. B, Heatmap showing the LR scores from SingleCellSignalR analysis of individual acral and non-acral cutaneous melanoma specimens. C, Circos plots showing the mean cell-cell interactions in non-acral cutaneous and acral melanoma samples.
As our analyses of the immune landscape identified reduced numbers of NK cells in acral melanomas, we next asked whether this resulted from differences in specific cell-cell interactions. The sample level analysis identified very few NK cells in most of the acral melanoma samples, with AM2 showing the highest NK cell proportion (Supplemental Figure 16). Interestingly, most acral melanoma samples had NK cells from the NK18 cluster whereas AM2 was mostly NK17 cluster that had lower expression of cytotoxicity markers (such as GMZM, GMZK) (Figure 2D and Supplemental Figures 16,17) (34), whereas AM4 and AM8-primary had NK cells with a more cytotoxic profile (NK18). An analysis of the inferred interactions between NK cells and all other tumor/immune cell types in both acral and non-acral cutaneous melanomas demonstrated most acral melanoma samples to have fewer inferred NK cell-immune/tumor interactions (Supplemental Figures 18A,B). Similarly, higher numbers of inferred NK cell-immune/tumor interactions were observed in non-acral cutaneous melanoma samples in an additional public scRNAseq dataset GSE115978 (Supplemental Figure 19). In the three acral melanoma samples with predicted NK cell-immune cell/tumor interactions (AM2, AM5, AM6, AM8-primary), the interactions observed were similar to those seen in non-acral cutaneous melanomas (Supplemental Figure 18B). An in-depth analysis of the specific inferred communication identified NK cell receptor (KIR2DL3, KLRF1)-mediated interaction with components of MHC (e.g., HLA-A, HLA-B, HLA-C and B2M) as occurring frequently in non-acral cutaneous melanomas (Supplemental Figure 20A,B). Similar NK cell-immune/tumor interactions were identified in the public melanoma scRNA-seq dataset GSE115978 (Supplemental Figure 21).
To better visualize the complexity of tumor-immune environment in acral vs. non-acral cutaneous melanoma we next mapped all cell-cell interactions and represented these as directional Circos plots (Figure 5C). For these analyses, we excluded AM7 as no significant immune-tumor or immune-immune cell interactions were observed (since the sample was mostly melanoma cells). Although our sample size was somewhat limited, there was a trend towards acral melanoma samples having a reduced density of cell-cell communication in the immune microenvironment compared to cutaneous melanomas. As one caveat, the cell-cell interactions between the acral and non-acral melanoma cohorts are likely not 100% comparable due to the differences in cell composition between the two sample sets.
The immune checkpoint expression landscape of acral melanoma
As immune checkpoints are key regulators of T cell activation and immune cell infiltration, we next determined the landscape of checkpoint expression in the cells of the acral immune microenvironment. A diverse pattern of checkpoint expression was noted across the immune cell types including expression of CTLA-4, PDCD1 (PD-1), LAG-3, TIGIT and VISTA (VSIR) in the T/NK cell population (Figure 6A). To further identify checkpoint genes of interests, we compared gene expression levels in the T/NK cell compartment in the acral and non-acral cutaneous melanoma samples. Within our small cohort it was noted that acral melanomas had significantly lower expression of TIM-3 (HAVCR2) and increased expression of VISTA and ADORA2 (adenosine receptor A2A) in their T/NK cells compared to non-acral cutaneous melanomas (Figure 6B and Supplemental Figure 22). At the individual sample level, it was found that some acral melanoma samples exhibited expression of ADORA2 in their T/NK cells with others having ADORA2 expression in their plasma cells (AM6 and AM8) and myeloid cells (AM2) (Figure 6C). It was further found that expression of CD73 (NT5E), the enzyme that generates adenosine (35), had a significantly higher expression in the acral melanoma samples compared to the non-acral cutaneous melanoma (Supplemental Figure 23). VISTA was expressed in 58.3% (95% CI: 46.7–69.9%) of myeloid cells, and 18.6% (95% CI: 10.0–27.1%) across all types (Supplemental Table 10). Although not differentially expressed between acral and non-acral samples, TIGIT was noted to be expressed in 22.3% (95% CI: 18.6–25.9%) of T/NK cells in acral melanoma samples. LAG3, was also found to be expressed in 12.9% (95% CI: 8.7 −17.2%) of T/NK cells and 12.6% (95% CI: −15.4 ~ 40.7%) of pDCs in acral melanoma samples (Figure 6C). However, as noted, due to the small sample size, the 95%CI is wider than desired for small cell clusters, such as pDCs. Although less TIM-3 expressed in acral than non-acral cutaneous melanoma in T/NK cells, it is worth noting that 29.2% (95% CI: 23.07–35.4%) of the myeloid cells in acral melanoma did express the gene. Sample level proportional expression is shown for multiple other checkpoints in Supplemental Figure 24. Multiplexed IHC analysis of VISTA, ADORA2 and CTLA-4 confirmed the presence of all three checkpoints in acral melanoma samples (Figure 6D,E,F). Expression of TIGIT, VISTA and ADORA2 in publicly available melanoma scRNA-seq datasets is shown in Supplemental Figure 25.
Figure 6. Immune checkpoint expression in acral and non-acral cutaneous melanomas.
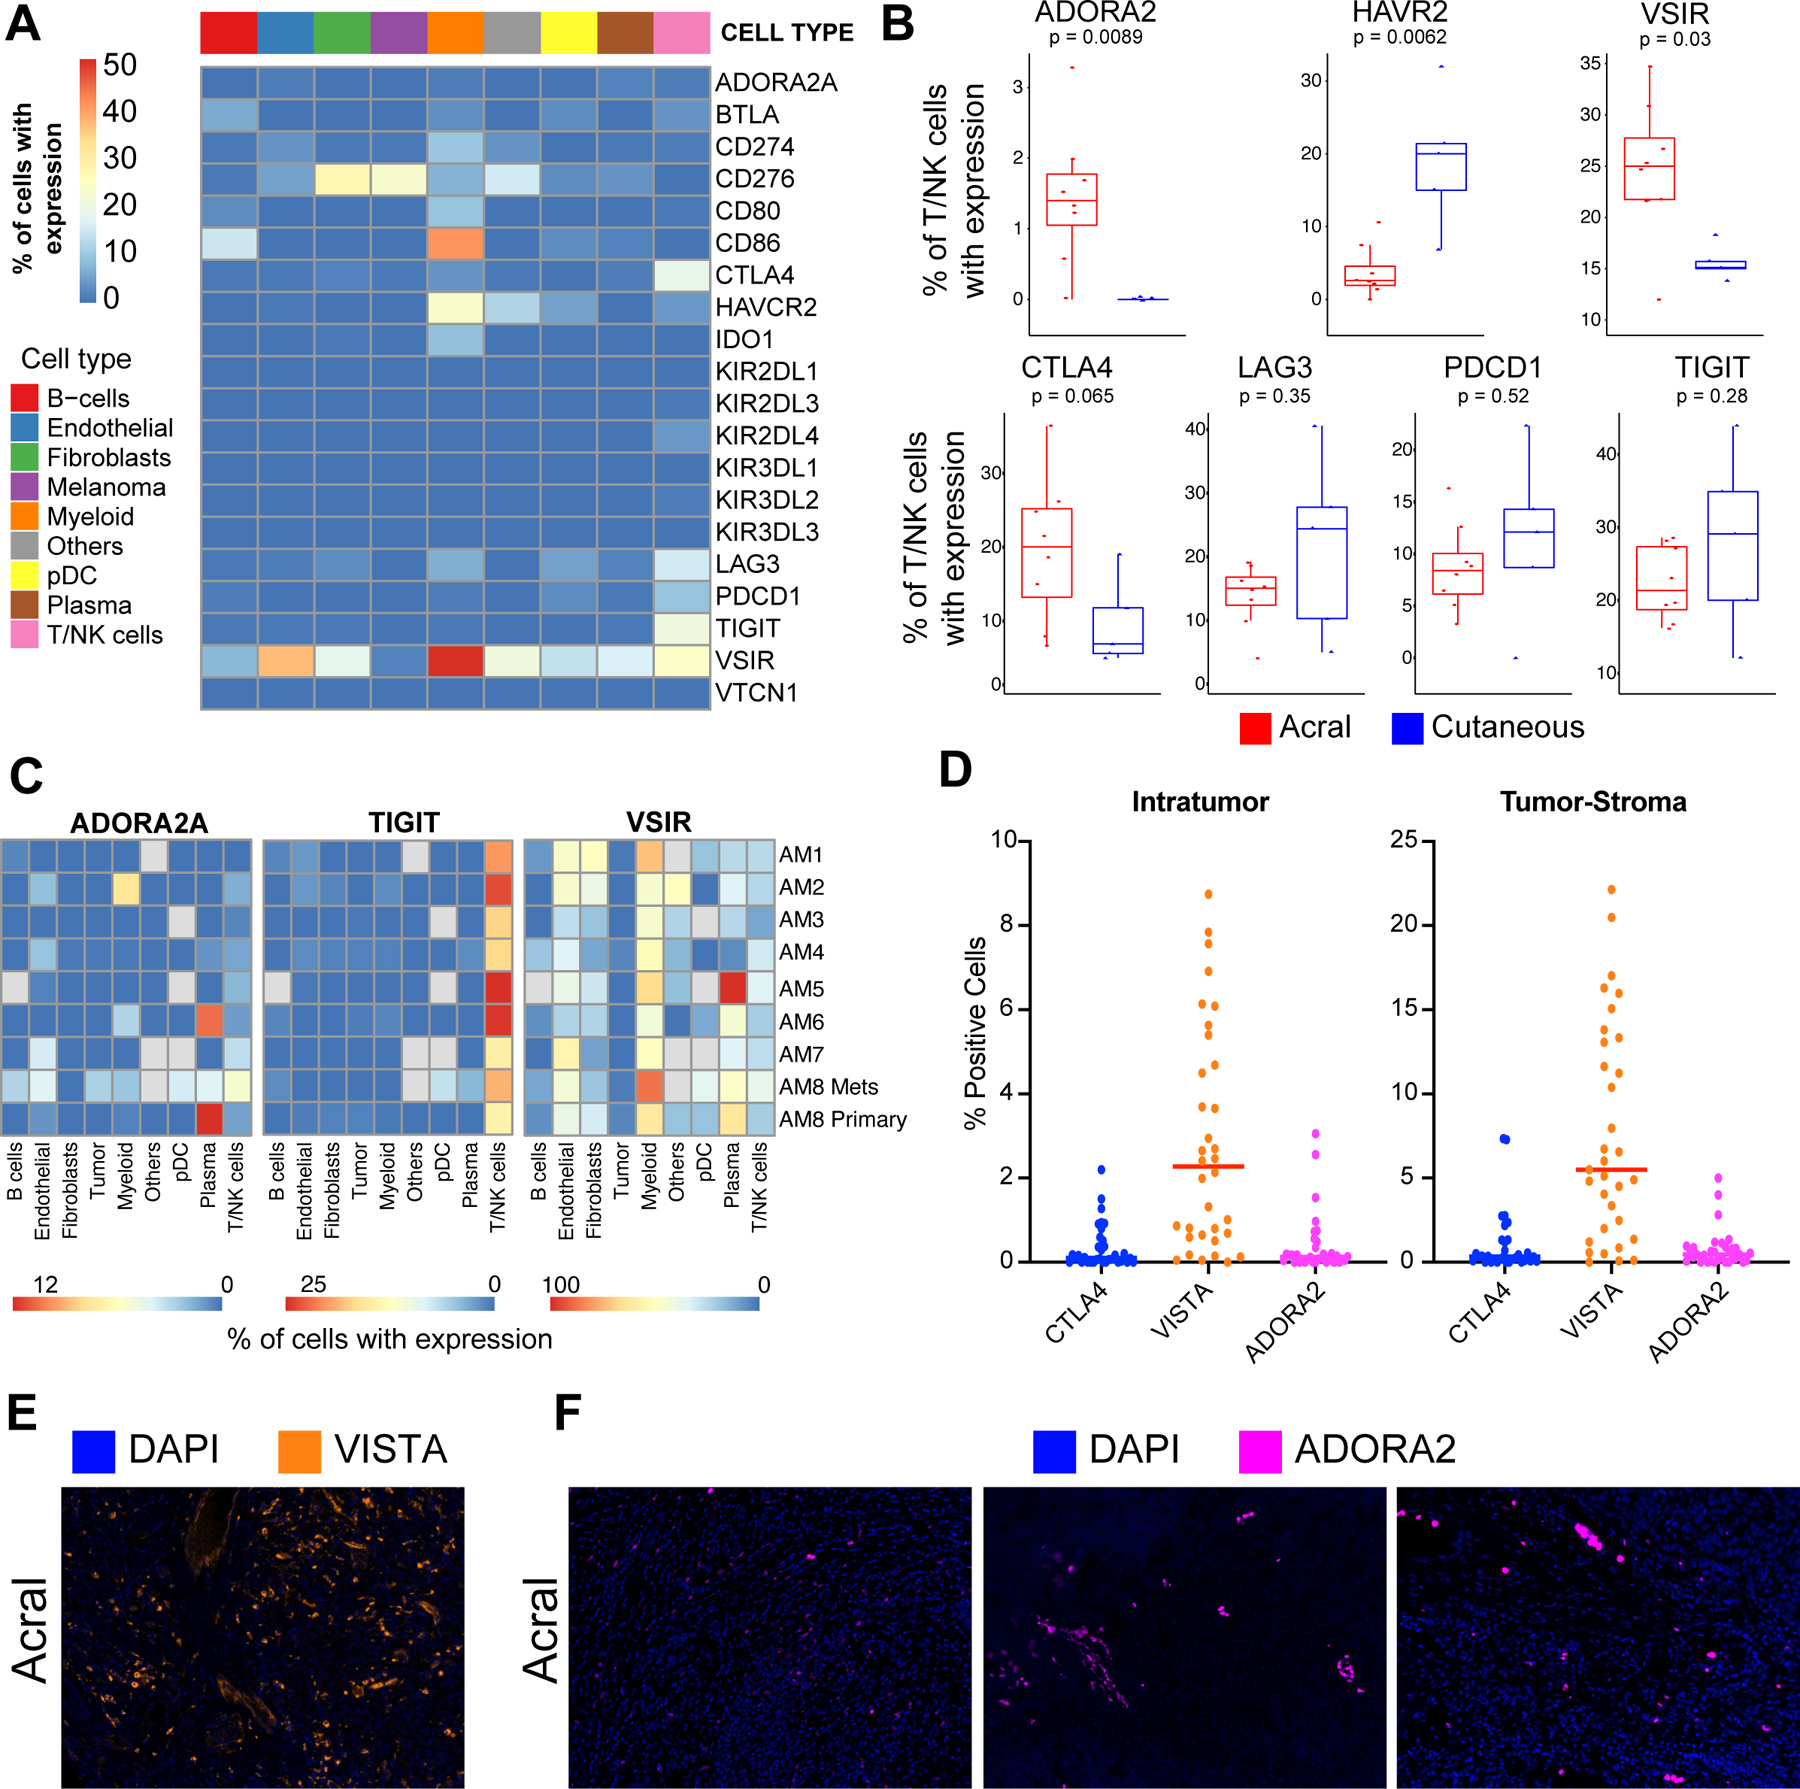
A, Heatmap showing the average expression of immune checkpoint receptors across major immune cell populations in acral melanoma samples. B, Boxplots showing expression of major immune checkpoints between acral and non-acral cutaneous melanoma sample cohorts (Wilcoxon test). C, Heatmaps showing proportion of cells expressing ADORA2, TIGIT and VISTA across cell types in individual samples of acral melanoma. D, Quantification of immunofluorescent staining of ADORA2, VISTA and CTLA4 checkpoints in acral melanomas, showing number of cells positive for each marker according to location within the tumor. E, Representative images of the immunofluorescent staining of VISTA in acral melanoma samples. F, Representative images of the immunofluorescent staining of ADORA2 in acral melanoma samples.
Discussion
We have undertaken the first comprehensive analysis of the immune/tumor transcriptional landscape of acral melanoma, a rare subtype of melanoma that arises on areas of the body with relatively little exposure to ultraviolet radiation (1). Our study identified unique features of the immune environment of acral melanoma, including immune checkpoints of translational interest that could represent novel therapeutic targets for this neglected disease.
In common with melanoma arising on non-acral skin, acral melanomas were found to have diverse immune landscapes, with a high degree of interpatient heterogeneity (10,11). The most heterogeneous cell compartment in acral melanoma was the tumor cells (10,11). Like non-acral cutaneous melanomas, acral melanomas were composed of multiple, transcriptionally heterogeneous cancer cell states (10,21,30). Alterations in immune pathways and metabolism were noted when comparing pooled primary acral melanoma samples to those from acral melanoma metastases.
Within our sample set, some acral melanoma specimens had a very low extent of immune infiltrate and a high percentage of cancer cells, whereas others were comprised mostly of immune cells and stromal cells with only a small proportion of cancer cells. In some cases, these differences may have been a reflection of decreased MHC expression on the tumor cells, as has been reported for other non-acral cutaneous melanoma and other cancers (36,37).
We next sought to understand how the TME of acral melanoma differed from that of non-acral cutaneous melanoma. Analysis of our cohort of acral melanoma samples showed there to be significantly less infiltration of NK cells, pDCs, CD8 (TEM) T cells and γδ T cells compared to non-acral cutaneous melanomas. Among these, γδ T cells constitute a minor T cell subset (1–10% of CD3+ cells in the peripheral blood) that have been previously implicated in the immune recognition of melanoma (38–40). In contrast to conventional αβ T cells, γδ T cells do not recognize antigen loaded onto MHC but instead recognize tumors independently of antigen processing and HLA restriction (40,41). Activation of γδ T cells can occur in response to recognition of metabolic intermediates generated by bacteria, parasites (42,43) and some tumors (44,45). Intriguingly, γδ T cells share multiple receptors with the innate immune system’s NK cells (such as NKG2D, NKp30, NKp44) which can directly trigger cytotoxic activity (46,47).
Like γδ T cells, NK cells can also be activated without DC priming and can recognize tumor cells that lack MHC expression (48). NK cells express cytotoxic proteins commonly found in CD8 T cells (such as GMZB, GZMK, perforin, etc.) that directly kill target cells (49). There is evidence from both preclinical and clinical studies in melanoma that recruitment of NK cells is associated with responses to both targeted therapy and immunotherapy (50,51). A recent scRNA-seq characterization of circulating and tumor-associated NK cells in patients with melanoma identified 7 unique clusters of cells (34). These appeared to represent different levels of functional specialization, with some clusters exhibiting higher expression of the chemokines XCL1 and XCL2, associated with a reduced cytotoxicity profile and others with increased expression of CCL3, CCL4 and CCL5 and a cytotoxicity gene expression signature (34). Analysis of the limited numbers of NK cells in our acral melanoma samples demonstrated most of the NK cells (73%) to be from one sample (AM2). Interestingly the NK cells in AM2 (NK17 cluster) seemed to express reduced levels of granzyme, indicating that these could be less cytotoxic (34).
Immune checkpoints limit immune cell recruitment and activation the TME. Quantification of immune checkpoint expression identified VISTA, ADORA2 and TIGIT as checkpoints that have not been previously characterized in acral melanoma. Although our data suggested ADORA2 and VISTA expression was higher in acral melanoma compared to non-acral cutaneous melanoma, our sample size was limited and some caution is advised.
ADORA2, which encodes the G-protein coupled adenosine A2A receptor (A2AR), is an important immune checkpoint that regulates the accumulation of CD8 effector T cells and NK cells (52–54). The major function of the adenosine/ADORA2 pathway is to protect tissues from immune-mediated damage following non-infectious inflammation. In tumors, altered metabolism and increased expression of the 5’-nucleotidase (NT5E: also known as CD73), which converts AMP to adenosine can lead to increased adenosine levels in the microenvironment (54,55). Our analyses identified high expression of ADORA2 in some acral melanoma specimens. Two of the major cell types known to be affected by increased tumoral adenosine levels are CD8 effector T cells and NK cells (53,54) - cell types that showed a lower accumulation in acral melanoma compared to non-acral cutaneous melanomas. We additionally noted a reduced accumulation of γδ T cells, which are known to express high levels of the adenosine A2A receptor (56). Multiple antagonists of ADORA2 have been developed, with early indications that these compounds work effectively in combination with anti-PD-1 with responses seen in patients who derived no benefit from prior anti-PD-1/PD-L1 therapy (57).
Another immune checkpoint identified in acral melanoma is the type I transmembrane protein VISTA (V-domain immunoglobin suppressor of T cell activation) (58). VISTA, which has a high degree of structural homology with PD-L1, is highly expressed in myeloid cells (including neutrophils, monocytes, macrophages and dendritic cells) as well as on naïve CD4 T cells and FOXP3+ Tregs (58,59). Preclinical studies have shown that inhibition of VISTA can suppress CD3-stimulated proliferation of CD4 and CD8 T cells as well as the production of IFNγ and IL-2 (59). In melanoma, single agent anti-PD-1 or the anti-PD-1/anti-CTLA-4 combination therapy increases VISTA expression on lymphocytes. Enforced expression of VISTA in melanoma cells reprograms the tumor immune microenvironment leading to increased PD-L1 expression in tumor-associated macrophages, increased Treg infiltration and reduced MHC expression on dendritic cells (60). Other studies have shown that increased VISTA expression in primary melanoma is a negative prognostic factor and that VISTA expression is associated with acquired resistance to anti-PD-1 therapy (61,62). In our acral melanoma cohort, VISTA was expressed across multiple cell types with the highest levels seen in myeloid cells. Significant expression was also noted in plasma cells, T and NK cells and endothelial cells. Expression of VISTA in acral melanomas indicates this could be another potentially valuable combination partner for anti-PD-1 therapy.
A further interesting immune checkpoint identified from our scRNA-seq analysis of acral melanoma specimens is the T cell immunoreceptor with immunoglobulin and ITIM domain (TIGIT) (63). This checkpoint, which is expressed on activated CD4 and CD8 T cells and NK cells, binds to CD112 and CD155 which are expressed on both melanoma cells and on antigen-presenting cells, such as DCs (64). The immunosuppressive activity that follows TIGIT activation is multi-factorial and can involve direct suppression of T and NK cell activity, the induction of an immunosuppressive phenotype in DCs, and the inhibition of CD226 signaling in tumor cells and DCs leading to impaired T cell and NK activation (63). At the same time, TIGIT is highly expressed on Tregs, with its activation leading to increased Treg stabilization (65). In melanoma patients, co-inhibition of PD-1 and TIGIT increases the proliferation and function of tumor-reactive CD8 T cells. There is also evidence that increased expression of the TIGIT ligand CD155 is associated with PD-1 therapy resistance in melanoma patients (66). Multiple studies have also demonstrated that TIGIT mediates exhaustion in NK cells, and that its blockade can restore NK cell function (67,68). It is therefore likely that the combination of anti-PD-1 and TIGIT checkpoint inhibition could be a potential strategy to restore T cell and NK cell function in acral melanoma.
Our study does have several caveats. Firstly, our sample size was quite limited (N=9 samples) and only one pair of specimens were matched. Additionally, comparing across different datasets, e.g. our data vs. TCGA and other single cell datasets can be confounded by technical and batch effects and therefore should be interpreted with caution.
Acral melanoma is a rare subtype of melanoma that has been less well characterized than cutaneous melanoma arising on non-acral skin. The current standard of care for acral melanoma is the same as that for non-acral cutaneous melanoma, but there is evidence that anti-PD-1 and anti-CTLA-4 checkpoint inhibition may be less effective in acral melanoma. Our analyses demonstrate that acral melanoma has a less T cell inflamed immune environment than non-acral cutaneous melanoma and may require additional checkpoint inhibition. Our identification of ADORA2, TIGIT and VISTA as novel immune checkpoints in acral melanoma offers new avenues for combination immunotherapy.
Supplementary Material
Translational relevance.
Acral melanoma is an understudied subtype of melanoma that arises on the non-hair-bearing skin of the soles, palms, and nail beds. Metastatic acral melanomas are treated primarily by immunotherapy, with worse outcomes than those observed in other cutaneous melanomas. Here, we provide the first single-cell analysis of primary and metastatic acral melanoma and identify fewer effector CD8 T cells and NK cells and an absence of γδ T cells compared to non-acral cutaneous melanoma. We further identify both VISTA, TIGIT and immune suppressive adenosine signaling as targetable immune checkpoints in acral melanoma.
Acknowledgements:
We thank Carlos Moran Segura, Jonathan Nguyen, and the Advanced Analytical and Digital Pathology team at Moffitt Cancer Center for technical assistance with tissue staining and analysis. We thank Lang Zhang, Chaomei Zhang and Sean Yoder from the Molecular Genomics Core at Moffitt Cancer Center for technical assistance with the WES and single cell RNAseq. This work was supported by a Team Science grant from the Melanoma Research Alliance (https://doi.org/10.48050/pc.gr.80550) and The Florida Department of Health (9LA03) to KSMS. The Molecular Genomics and Advanced Analytical and Digital Pathology and Bioinformatics and Biostatistics Core at Moffitt are supported in part by the NCI through a Cancer Center Support Grant (P30-CA076292) and the Moffitt Foundation. We would like to thank Lesa Kennedy and Bill Christy for their generous support of the Moffitt Melanoma and Skin Cancer Center of Excellence that significantly contributed to these studies.
Footnotes
Conflicts of interest:
Dr. Sarnaik is a co-inventor on a patent application with Provectus Biopharmaceuticals and has received consulting fees from Iovance Biotherapeutics, Guidepoint, Defined Health, Huron Consulting Group, KeyQuest Health Inc, and Gerson Lehrman Group and speaker fees from Physicians’ Educational Resource (PER) LLC, Medscape and Medstar Health. Dr. Sondak is a consultant for Bristol Myers Squibb, Eisai, Merck, Novartis, Regeneron and Replimune and receives research funding unrelated to this topic from Neogene Therapeutics. Dr. Koomen receives salary support from Bristol Myers Squibb unrelated to this work. Dr. Tarhini reports Consulting/Advisory Board Participation: Merck, Bristol Myers Squibb, Novartis, Genentech-Roche, Partner Therapeutics, Sanofi-Genzyme, Regeneron, Eisai and Clinigen. He also has support for contracted research from OncoSec, Clinigen, Genentech-Roche, Bristol Myers Squibb, Nektar Therapeutics, Sanofi-Genzyme, Regeneron, Navigate. Dr Khushalani is a paid advisor for Array Biopharma, Bristol Myers Squibb, EMD Serono, Genentech, HUYA Bioscience International, Nektar, Regeneron, Immunocore, Merck, Astra Zeneca, Incyte and Jounce. He receives research funding from HUYA Bioscience International, Regeneron, Merck, Amgen, Celgene, GlaxoSmithKline, Novartis, Replimune, and BMS. All other authors have no conflicts of interest.
References
- 1.Chen YA, Teer JK, Eroglu Z, Wu JY, Koomen JM, Karreth FA, et al. Translational pathology, genomics and the development of systemic therapies for acral melanoma. Semin Cancer Biol 2020;61:149–57 doi 10.1016/j.semcancer.2019.10.017. [DOI] [PMC free article] [PubMed] [Google Scholar]
- 2.Bradford PT, Goldstein AM, McMaster ML, Tucker MA. Acral lentiginous melanoma: incidence and survival patterns in the United States, 1986–2005. Arch Dermatol 2009;145(4):427–34 doi 10.1001/archdermatol.2008.609. [DOI] [PMC free article] [PubMed] [Google Scholar]
- 3.Smalley KSM, Teer JK, Chen YA, Wu JY, Yao J, Koomen JM, et al. A Mutational Survey of Acral Nevi. JAMA Dermatol 2021;157(7):831–5 doi 10.1001/jamadermatol.2021.0793. [DOI] [PMC free article] [PubMed] [Google Scholar]
- 4.Newell F, Wilmott JS, Johansson PA, Nones K, Addala V, Mukhopadhyay P, et al. Whole-genome sequencing of acral melanoma reveals genomic complexity and diversity. Nat Commun 2020;11(1):5259 doi 10.1038/s41467-020-18988-3. [DOI] [PMC free article] [PubMed] [Google Scholar]
- 5.Liang WS, Hendricks W, Kiefer J, Schmidt J, Sekar S, Carpten J, et al. Integrated genomic analyses reveal frequent TERT aberrations in acral melanoma. Genome Res 2017;27(4):524–32 doi 10.1101/gr.213348.116. [DOI] [PMC free article] [PubMed] [Google Scholar]
- 6.Bai X, Si L, Chi CY, Sheng X, Cui C, Kong Y, et al. Efficacy and tolerability of vemurafenib in BRAF-mutant acral and mucosal melanoma. J Clin Oncol 2016;35(15):e21017. [Google Scholar]
- 7.Kim HK, Lee S, Kim K, Heo MH, Lee H, Cho J, et al. Efficacy of BRAF Inhibitors in Asian Metastatic Melanoma Patients: Potential Implications of Genomic Sequencing in BRAF-Mutated Melanoma. Transl Oncol 2016;9(6):557–64 doi 10.1016/j.tranon.2016.09.004. [DOI] [PMC free article] [PubMed] [Google Scholar]
- 8.Shoushtari AN, Munhoz RR, Kuk D, Ott PA, Johnson DB, Tsai KK, et al. The efficacy of anti-PD-1 agents in acral and mucosal melanoma. Cancer 2016;122(21):3354–62 doi 10.1002/cncr.30259. [DOI] [PMC free article] [PubMed] [Google Scholar]
- 9.Kaunitz GJ, Cottrell TR, Lilo M, Muthappan V, Esandrio J, Berry S, et al. Melanoma subtypes demonstrate distinct PD-L1 expression profiles. Lab Invest 2017;97(9):1063–71 doi 10.1038/labinvest.2017.64. [DOI] [PMC free article] [PubMed] [Google Scholar]
- 10.Smalley I, Chen Z, Phadke M, Li J, Yu X, Wyatt C, et al. Single-Cell Characterization of the Immune Microenvironment of Melanoma Brain and Leptomeningeal Metastases. Clin Cancer Res 2021. doi 10.1158/1078-0432.CCR-21-1694. [DOI] [PMC free article] [PubMed] [Google Scholar]
- 11.Tirosh I, Izar B, Prakadan SM, Wadsworth MH 2nd, Treacy D, Trombetta JJ, et al. Dissecting the multicellular ecosystem of metastatic melanoma by single-cell RNA-seq. Science 2016;352(6282):189–96 doi 10.1126/science.aad0501. [DOI] [PMC free article] [PubMed] [Google Scholar]
- 12.Jerby-Arnon L, Shah P, Cuoco MS, Rodman C, Su MJ, Melms JC, et al. A Cancer Cell Program Promotes T Cell Exclusion and Resistance to Checkpoint Blockade. Cell 2018;175(4):984–97 e24 doi 10.1016/j.cell.2018.09.006. [DOI] [PMC free article] [PubMed] [Google Scholar]
- 13.Boyle TA, Mondal AK, Saeed-Vafa D, Ananth S, Ahluwalia P, Kothapalli R, et al. Guideline-Adherent Clinical Validation of a Comprehensive 170-Gene DNA/RNA Panel for Determination of Small Variants, Copy Number Variations, Splice Variants, and Fusions on a Next-Generation Sequencing Platform in the CLIA Setting. Front Genet 2021;12:503830 doi 10.3389/fgene.2021.503830. [DOI] [PMC free article] [PubMed] [Google Scholar]
- 14.Li H, Durbin R. Fast and accurate short read alignment with Burrows-Wheeler transform. Bioinformatics 2009;25(14):1754–60 doi 10.1093/bioinformatics/btp324. [DOI] [PMC free article] [PubMed] [Google Scholar]
- 15.DePristo MA, Banks E, Poplin R, Garimella KV, Maguire JR, Hartl C, et al. A framework for variation discovery and genotyping using next-generation DNA sequencing data. Nat Genet 2011;43(5):491–8 doi 10.1038/ng.806. [DOI] [PMC free article] [PubMed] [Google Scholar]
- 16.Cibulskis K, Lawrence MS, Carter SL, Sivachenko A, Jaffe D, Sougnez C, et al. Sensitive detection of somatic point mutations in impure and heterogeneous cancer samples. Nat Biotechnol 2013;31(3):213–9 doi 10.1038/nbt.2514. [DOI] [PMC free article] [PubMed] [Google Scholar]
- 17.Wang K, Li M, Hakonarson H. ANNOVAR: functional annotation of genetic variants from high-throughput sequencing data. Nucleic Acids Res 2010;38(16):e164 doi 10.1093/nar/gkq603. [DOI] [PMC free article] [PubMed] [Google Scholar]
- 18.Tran HTN, Ang KS, Chevrier M, Zhang X, Lee NYS, Goh M, et al. A benchmark of batch-effect correction methods for single-cell RNA sequencing data. Genome Biol 2020;21(1):12 doi 10.1186/s13059-019-1850-9. [DOI] [PMC free article] [PubMed] [Google Scholar]
- 19.Yu X, Chen YA, Conejo-Garcia JR, Chung CH, Wang X. Estimation of immune cell content in tumor using single-cell RNA-seq reference data. BMC cancer 2019;19(1):715 doi 10.1186/s12885-019-5927-3. [DOI] [PMC free article] [PubMed] [Google Scholar]
- 20.Zilionis R, Engblom C, Pfirschke C, Savova V, Zemmour D, Saatcioglu HD, et al. Single-Cell Transcriptomics of Human and Mouse Lung Cancers Reveals Conserved Myeloid Populations across Individuals and Species. Immunity 2019;50(5):1317–34 e10 doi 10.1016/j.immuni.2019.03.009. [DOI] [PMC free article] [PubMed] [Google Scholar]
- 21.Cabello-Aguilar S, Alame M, Kon-Sun-Tack F, Fau C, Lacroix M, Colinge J. SingleCellSignalR: inference of intercellular networks from single-cell transcriptomics. Nucleic Acids Res 2020;48(10):e55 doi 10.1093/nar/gkaa183. [DOI] [PMC free article] [PubMed] [Google Scholar]
- 22.Li J, Smalley I, Schell MJ, Smalley KSM, Chen YA. SinCHet: a MATLAB toolbox for single cell heterogeneity analysis in cancer. Bioinformatics 2017;33(18):2951–3 doi 10.1093/bioinformatics/btx297. [DOI] [PMC free article] [PubMed] [Google Scholar]
- 23.Butler A, Hoffman P, Smibert P, Papalexi E, Satija R. Integrating single-cell transcriptomic data across different conditions, technologies, and species. Nat Biotechnol 2018;36(5):411–20 doi 10.1038/nbt.4096. [DOI] [PMC free article] [PubMed] [Google Scholar]
- 24.Szklarczyk D, Gable AL, Lyon D, Junge A, Wyder S, Huerta-Cepas J, et al. STRING v11: protein-protein association networks with increased coverage, supporting functional discovery in genome-wide experimental datasets. Nucleic Acids Res 2019;47(D1):D607–D13 doi 10.1093/nar/gky1131. [DOI] [PMC free article] [PubMed] [Google Scholar]
- 25.Aran D, Hu Z, Butte AJ. xCell: digitally portraying the tissue cellular heterogeneity landscape. Genome Biol 2017;18(1):220 doi 10.1186/s13059-017-1349-1. [DOI] [PMC free article] [PubMed] [Google Scholar]
- 26.Wang Y, Deng J, Wang L, Zhou T, Yang J, Tian Z, et al. Expression and clinical significance of PD-L1, B7-H3, B7-H4 and VISTA in craniopharyngioma. J Immunother Cancer 2020;8(2) doi 10.1136/jitc-2019-000406. [DOI] [PMC free article] [PubMed] [Google Scholar]
- 27.Brown C, Sekhavati F, Cardenes R, Windmueller C, Dacosta K, Rodriguez-Canales J, et al. CTLA-4 Immunohistochemistry and Quantitative Image Analysis for Profiling of Human Cancers. J Histochem Cytochem 2019;67(12):901–18 doi 10.1369/0022155419882292. [DOI] [PMC free article] [PubMed] [Google Scholar]
- 28.Stamp LK, Hazlett J, Roberts RL, Frampton C, Highton J, Hessian PA. Adenosine receptor expression in rheumatoid synovium: a basis for methotrexate action. Arthritis Res Ther 2012;14(3):R138 doi 10.1186/ar3871. [DOI] [PMC free article] [PubMed] [Google Scholar]
- 29.Smalley I, Kim E, Li J, Spence P, Wyatt CJ, Eroglu Z, et al. Leveraging transcriptional dynamics to improve BRAF inhibitor responses in melanoma. EBioMedicine 2019. doi 10.1016/j.ebiom.2019.09.023. [DOI] [PMC free article] [PubMed] [Google Scholar]
- 30.Rambow F, Rogiers A, Marin-Bejar O, Aibar S, Femel J, Dewaele M, et al. Toward Minimal Residual Disease-Directed Therapy in Melanoma. Cell 2018;174(4):843–55 e19 doi 10.1016/j.cell.2018.06.025. [DOI] [PubMed] [Google Scholar]
- 31.Tsoi J, Robert L, Paraiso K, Galvan C, Sheu KM, Lay J, et al. Multi-stage Differentiation Defines Melanoma Subtypes with Differential Vulnerability to Drug-Induced Iron-Dependent Oxidative Stress. Cancer Cell 2018;33(5):890–904 e5 doi 10.1016/j.ccell.2018.03.017. [DOI] [PMC free article] [PubMed] [Google Scholar]
- 32.Cantelli G, Orgaz JL, Rodriguez-Hernandez I, Karagiannis P, Maiques O, Matias-Guiu X, et al. TGF-beta-Induced Transcription Sustains Amoeboid Melanoma Migration and Dissemination. Curr Biol 2015;25(22):2899–914 doi 10.1016/j.cub.2015.09.054. [DOI] [PMC free article] [PubMed] [Google Scholar]
- 33.Howlin J, Cirenajwis H, Lettiero B, Staaf J, Lauss M, Saal L, et al. Loss of CITED1, an MITF regulator, drives a phenotype switch in vitro and can predict clinical outcome in primary melanoma tumours. PeerJ 2015;3:e788 doi 10.7717/peerj.788. [DOI] [PMC free article] [PubMed] [Google Scholar]
- 34.de Andrade LF, Lu Y, Luoma A, Ito Y, Pan D, Pyrdol JW, et al. Discovery of specialized NK cell populations infiltrating human melanoma metastases. JCI Insight 2019;4(23) doi 10.1172/jci.insight.133103. [DOI] [PMC free article] [PubMed] [Google Scholar]
- 35.Allard D, Allard B, Gaudreau PO, Chrobak P, Stagg J. CD73-adenosine: a next-generation target in immuno-oncology. Immunotherapy 2016;8(2):145–63 doi 10.2217/imt.15.106. [DOI] [PubMed] [Google Scholar]
- 36.Maeurer MJ, Gollin SM, Storkus WJ, Swaney W, Karbach J, Martin D, et al. Tumor escape from immune recognition: loss of HLA-A2 melanoma cell surface expression is associated with a complex rearrangement of the short arm of chromosome 6. Clin Cancer Res 1996;2(4):641–52. [PubMed] [Google Scholar]
- 37.Dhatchinamoorthy K, Colbert JD, Rock KL. Cancer Immune Evasion Through Loss of MHC Class I Antigen Presentation. Front Immunol 2021;12:636568 doi 10.3389/fimmu.2021.636568. [DOI] [PMC free article] [PubMed] [Google Scholar]
- 38.Kabelitz D, Serrano R, Kouakanou L, Peters C, Kalyan S. Cancer immunotherapy with gammadelta T cells: many paths ahead of us. Cell Mol Immunol 2020;17(9):925–39 doi 10.1038/s41423-020-0504-x. [DOI] [PMC free article] [PubMed] [Google Scholar]
- 39.Benveniste PM, Roy S, Nakatsugawa M, Chen ELY, Nguyen L, Millar DG, et al. Generation and molecular recognition of melanoma-associated antigen-specific human gammadelta T cells. Sci Immunol 2018;3(30) doi 10.1126/sciimmunol.aav4036. [DOI] [PubMed] [Google Scholar]
- 40.Parker CM, Groh V, Band H, Porcelli SA, Morita C, Fabbi M, et al. Evidence for extrathymic changes in the T cell receptor gamma/delta repertoire. J Exp Med 1990;171(5):1597–612 doi 10.1084/jem.171.5.1597. [DOI] [PMC free article] [PubMed] [Google Scholar]
- 41.Vasudev A, Ying CT, Ayyadhury S, Puan KJ, Andiappan AK, Nyunt MS, et al. gamma/delta T cell subsets in human aging using the classical alpha/beta T cell model. J Leukoc Biol 2014;96(4):647–55 doi 10.1189/jlb.5A1213-650RR. [DOI] [PubMed] [Google Scholar]
- 42.Hintz M, Reichenberg A, Altincicek B, Bahr U, Gschwind RM, Kollas AK, et al. Identification of (E)-4-hydroxy-3-methyl-but-2-enyl pyrophosphate as a major activator for human gammadelta T cells in Escherichia coli. FEBS Lett 2001;509(2):317–22 doi 10.1016/s0014-5793(01)03191-x. [DOI] [PubMed] [Google Scholar]
- 43.Nerdal PT, Peters C, Oberg HH, Zlatev H, Lettau M, Quabius ES, et al. Butyrophilin 3A/CD277-Dependent Activation of Human gammadelta T Cells: Accessory Cell Capacity of Distinct Leukocyte Populations. J Immunol 2016;197(8):3059–68 doi 10.4049/jimmunol.1600913. [DOI] [PubMed] [Google Scholar]
- 44.Freed-Pastor WA, Mizuno H, Zhao X, Langerod A, Moon SH, Rodriguez-Barrueco R, et al. Mutant p53 disrupts mammary tissue architecture via the mevalonate pathway. Cell 2012;148(1–2):244–58 doi 10.1016/j.cell.2011.12.017. [DOI] [PMC free article] [PubMed] [Google Scholar]
- 45.Gruenbacher G, Nussbaumer O, Gander H, Steiner B, Leonhartsberger N, Thurnher M. Stress-related and homeostatic cytokines regulate Vgamma9Vdelta2 T-cell surveillance of mevalonate metabolism. Oncoimmunology 2014;3(8):e953410 doi 10.4161/21624011.2014.953410. [DOI] [PMC free article] [PubMed] [Google Scholar]
- 46.Groh V, Rhinehart R, Secrist H, Bauer S, Grabstein KH, Spies T. Broad tumor-associated expression and recognition by tumor-derived gamma delta T cells of MICA and MICB. Proc Natl Acad Sci U S A 1999;96(12):6879–84 doi 10.1073/pnas.96.12.6879. [DOI] [PMC free article] [PubMed] [Google Scholar]
- 47.Hudspeth K, Silva-Santos B, Mavilio D. Natural cytotoxicity receptors: broader expression patterns and functions in innate and adaptive immune cells. Front Immunol 2013;4:69 doi 10.3389/fimmu.2013.00069. [DOI] [PMC free article] [PubMed] [Google Scholar]
- 48.Guillerey C, Huntington ND, Smyth MJ. Targeting natural killer cells in cancer immunotherapy. Nat Immunol 2016;17(9):1025–36 doi 10.1038/ni.3518. [DOI] [PubMed] [Google Scholar]
- 49.Topham NJ, Hewitt EW. Natural killer cell cytotoxicity: how do they pull the trigger? Immunology 2009;128(1):7–15 doi 10.1111/j.1365-2567.2009.03123.x. [DOI] [PMC free article] [PubMed] [Google Scholar]
- 50.Ferrari de Andrade L, Ngiow SF, Stannard K, Rusakiewicz S, Kalimutho M, Khanna KK, et al. Natural killer cells are essential for the ability of BRAF inhibitors to control BRAFV600E-mutant metastatic melanoma. Cancer Res 2014;74(24):7298–308 doi 10.1158/0008-5472.CAN-14-1339. [DOI] [PubMed] [Google Scholar]
- 51.Lee H, Quek C, Silva I, Tasker A, Batten M, Rizos H, et al. Integrated molecular and immunophenotypic analysis of NK cells in anti-PD-1 treated metastatic melanoma patients. Oncoimmunology 2019;8(2) doi ARTN e1537581 10.1080/2162402X.2018.1537581. [DOI] [PMC free article] [PubMed] [Google Scholar]
- 52.Ohta A, Sitkovsky M. Role of G-protein-coupled adenosine receptors in downregulation of inflammation and protection from tissue damage. Nature 2001;414(6866):916–20 doi 10.1038/414916a. [DOI] [PubMed] [Google Scholar]
- 53.Sitkovsky MV, Hatfield S, Abbott R, Belikoff B, Lukashev D, Ohta A. Hostile, hypoxia-A2-adenosinergic tumor biology as the next barrier to overcome for tumor immunologists. Cancer Immunol Res 2014;2(7):598–605 doi 10.1158/2326-6066.CIR-14-0075. [DOI] [PMC free article] [PubMed] [Google Scholar]
- 54.Ohta A, Gorelik E, Prasad SJ, Ronchese F, Lukashev D, Wong MK, et al. A2A adenosine receptor protects tumors from antitumor T cells. Proc Natl Acad Sci U S A 2006;103(35):13132–7 doi 10.1073/pnas.0605251103. [DOI] [PMC free article] [PubMed] [Google Scholar]
- 55.Young A, Ngiow SF, Barkauskas DS, Sult E, Hay C, Blake SJ, et al. Co-inhibition of CD73 and A2AR Adenosine Signaling Improves Anti-tumor Immune Responses. Cancer Cell 2016;30(3):391–403 doi 10.1016/j.ccell.2016.06.025. [DOI] [PubMed] [Google Scholar]
- 56.Liang D, Woo JI, Shao H, Born WK, O’Brien RL, Kaplan HJ, et al. Ability of gammadelta T cells to modulate the Foxp3 T cell response is dependent on adenosine. PLoS One 2018;13(5):e0197189 doi 10.1371/journal.pone.0197189. [DOI] [PMC free article] [PubMed] [Google Scholar]
- 57.Fong L, Hotson A, Powderly JD, Sznol M, Heist RS, Choueiri TK, et al. Adenosine 2A Receptor Blockade as an Immunotherapy for Treatment-Refractory Renal Cell Cancer. Cancer Discov 2020;10(1):40–53 doi 10.1158/2159-8290.CD-19-0980. [DOI] [PMC free article] [PubMed] [Google Scholar]
- 58.Huang X, Zhang X, Li E, Zhang G, Wang X, Tang T, et al. VISTA: an immune regulatory protein checking tumor and immune cells in cancer immunotherapy. J Hematol Oncol 2020;13(1):83 doi 10.1186/s13045-020-00917-y. [DOI] [PMC free article] [PubMed] [Google Scholar]
- 59.Lines JL, Pantazi E, Mak J, Sempere LF, Wang L, O’Connell S, et al. VISTA Is an Immune Checkpoint Molecule for Human T Cells. Cancer research 2014;74(7):1924–32 doi 10.1158/0008-5472.Can-13-1504. [DOI] [PMC free article] [PubMed] [Google Scholar]
- 60.Rosenbaum SR, Knecht M, Mollaee M, Zhong Z, Erkes DA, McCue PA, et al. FOXD3 Regulates VISTA Expression in Melanoma. Cell reports 2020;30(2):510–24 e6 doi 10.1016/j.celrep.2019.12.036. [DOI] [PMC free article] [PubMed] [Google Scholar]
- 61.Kakavand H, Jackett LA, Menzies AM, Gide TN, Carlino MS, Saw RPM, et al. Negative immune checkpoint regulation by VISTA: a mechanism of acquired resistance to anti-PD-1 therapy in metastatic melanoma patients. Mod Pathol 2017;30(12):1666–76 doi 10.1038/modpathol.2017.89. [DOI] [PubMed] [Google Scholar]
- 62.Kuklinski LF, Yan S, Li Z, Fisher JL, Cheng C, Noelle RJ, et al. VISTA expression on tumor-infiltrating inflammatory cells in primary cutaneous melanoma correlates with poor disease-specific survival. Cancer Immunol Immunother 2018;67(7):1113–21 doi 10.1007/s00262-018-2169-1. [DOI] [PMC free article] [PubMed] [Google Scholar]
- 63.Chauvin JM, Zarour HM. TIGIT in cancer immunotherapy. J Immunother Cancer 2020;8(2) doi 10.1136/jitc-2020-000957. [DOI] [PMC free article] [PubMed] [Google Scholar]
- 64.Stanietsky N, Simic H, Arapovic J, Toporik A, Levy O, Novik A, et al. The interaction of TIGIT with PVR and PVRL2 inhibits human NK cell cytotoxicity. Proc Natl Acad Sci U S A 2009;106(42):17858–63 doi 10.1073/pnas.0903474106. [DOI] [PMC free article] [PubMed] [Google Scholar]
- 65.Joller N, Lozano E, Burkett PR, Patel B, Xiao S, Zhu C, et al. Treg cells expressing the coinhibitory molecule TIGIT selectively inhibit proinflammatory Th1 and Th17 cell responses. Immunity 2014;40(4):569–81 doi 10.1016/j.immuni.2014.02.012. [DOI] [PMC free article] [PubMed] [Google Scholar]
- 66.Lepletier A, Madore J, O’Donnell JS, Johnston RL, Li XY, McDonald E, et al. Tumor CD155 Expression Is Associated with Resistance to Anti-PD1 Immunotherapy in Metastatic Melanoma. Clin Cancer Res 2020;26(14):3671–81 doi 10.1158/1078-0432.CCR-19-3925. [DOI] [PubMed] [Google Scholar]
- 67.Zhang Q, Bi J, Zheng X, Chen Y, Wang H, Wu W, et al. Blockade of the checkpoint receptor TIGIT prevents NK cell exhaustion and elicits potent anti-tumor immunity. Nat Immunol 2018;19(7):723–32 doi 10.1038/s41590-018-0132-0. [DOI] [PubMed] [Google Scholar]
- 68.Xu F, Sunderland A, Zhou Y, Schulick RD, Edil BH, Zhu Y. Blockade of CD112R and TIGIT signaling sensitizes human natural killer cell functions. Cancer Immunol Immunother 2017;66(10):1367–75 doi 10.1007/s00262-017-2031-x. [DOI] [PMC free article] [PubMed] [Google Scholar]
Associated Data
This section collects any data citations, data availability statements, or supplementary materials included in this article.
Supplementary Materials
Data Availability Statement
Raw FastQ and iscva.h5 files of scRNA-seq have been deposited in the NCBI SRA (NCBI, RRID:SCR_00647) database under SRA accession number PRJNA784961 and the GEO database under accession number GSE189889. Data are also available for analysis in ISCVA: iscva.moffitt.org