


Figure 1. LAG3 inhibits T cell function in the absence of MHC class II ligation.
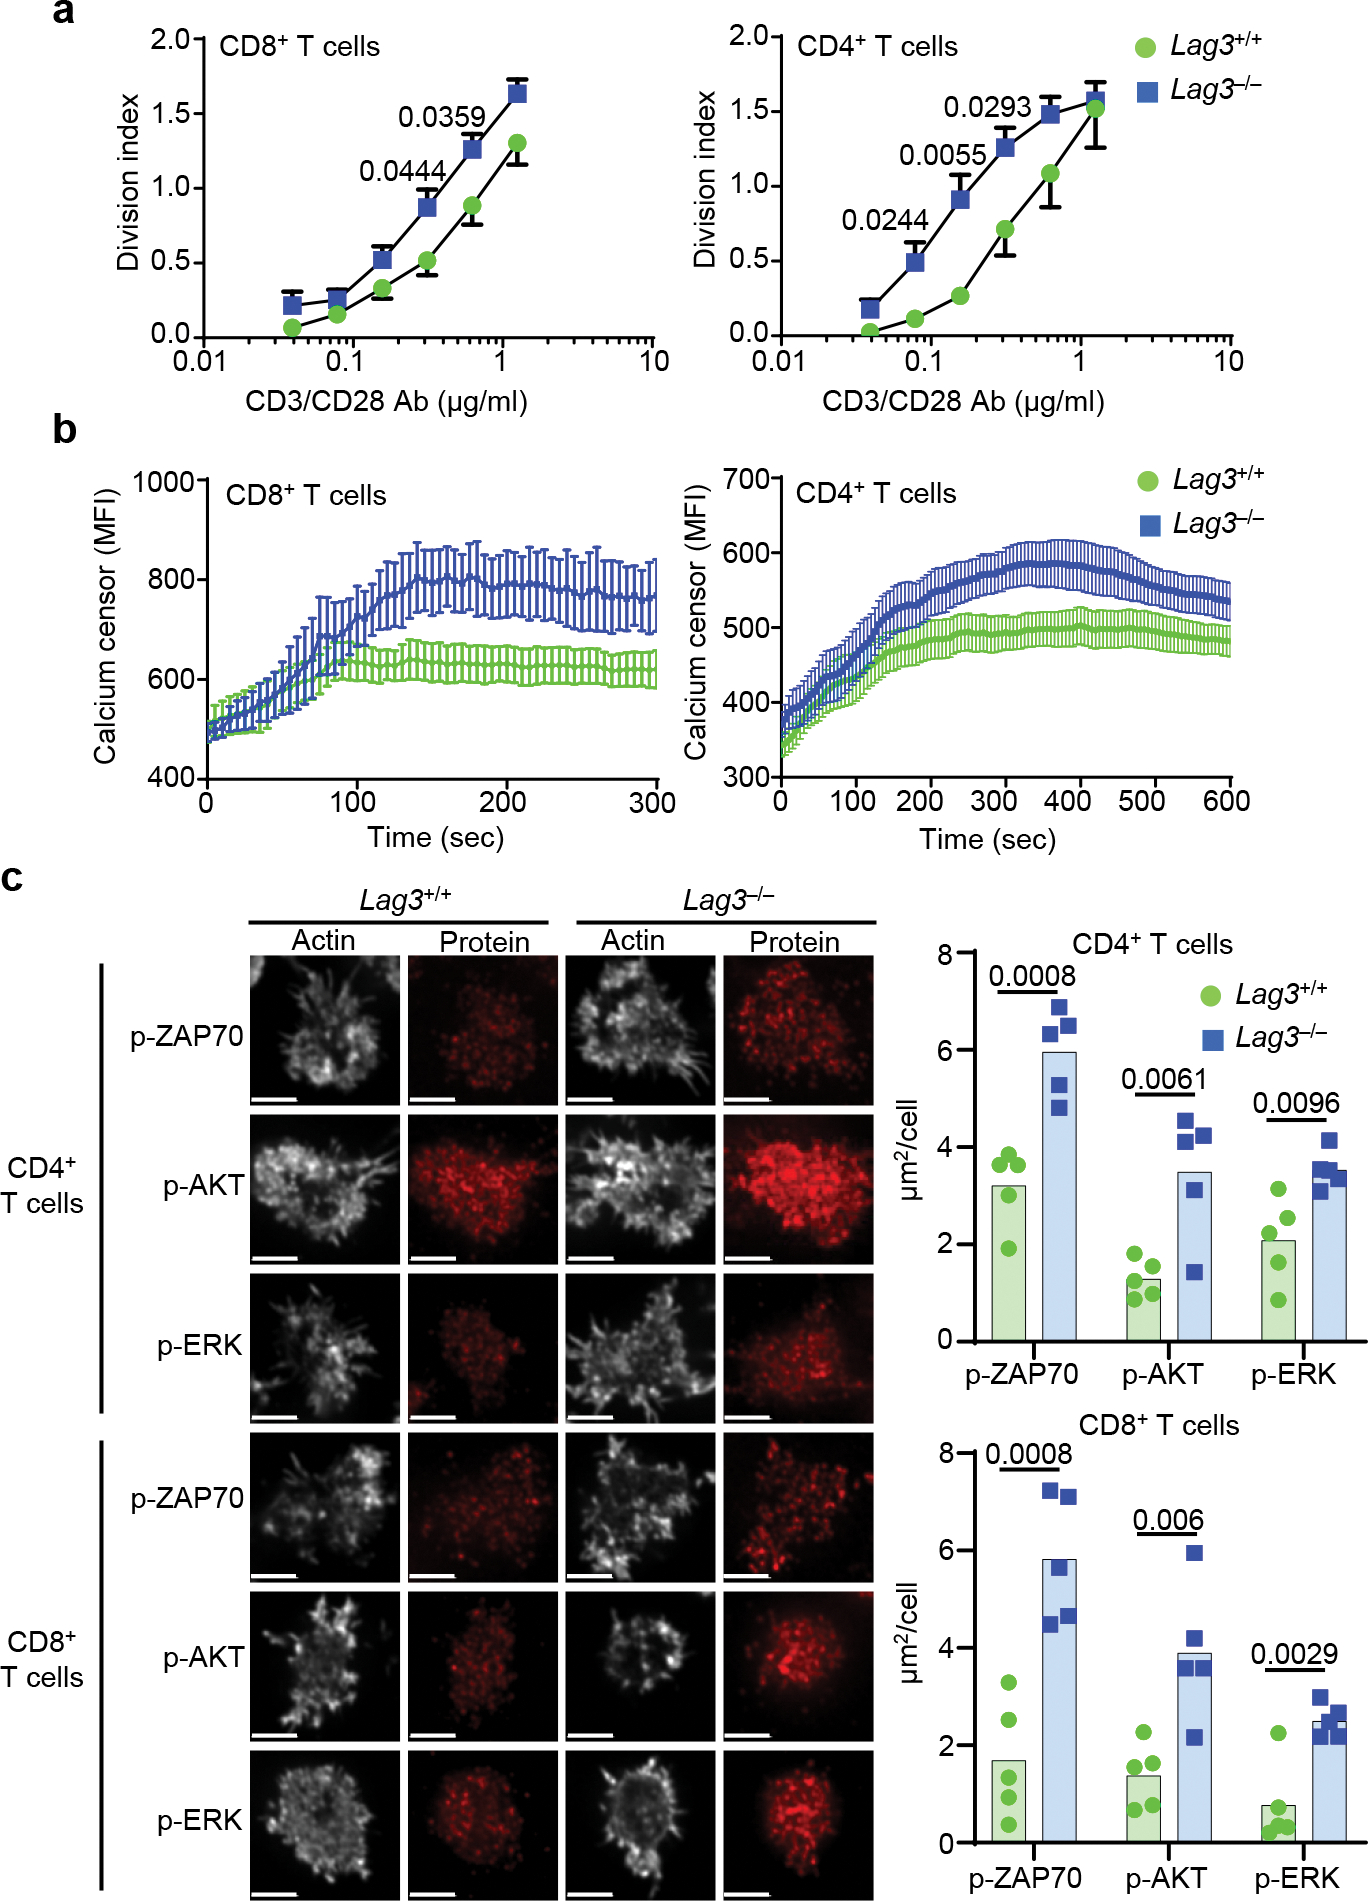
(a) Proliferation of CD8+ or CD4+ T cells from spleen and lymph nodes of LAG3+/+ and LAG3−/− mice stimulated with plate bound CD3 and CD28 Abs for 72 hr. (b) Calcium flux in CD8+ or CD4+T cell of LAG3+/+ and LAG3−/− mice isolated as above restimulated on planar lipid bilayers containing TCRβ Ab. (c) Representative confocal images of TCR–proximal signaling events in CD4+ and CD8+ T cells from spleen and lymph nodes of Lag3+/+ and Lag3−/− mice, stimulated for 48 h with plate bound CD3ε and CD28 Abs to induce LAG3 expression, rested for 48h in the presence of IL-2 and re-stimulated with TCRβ Abs for 15 min on stimulating lipid bilayers with quantification of single cell intensity measurements presented as area of puncta representing phosphorylated signaling proteins (Scale bar = 5μm). (a,b) Data represents the mean of n=7 (LAG3+/+) and n= 9 (LAG3−/−) individual mice and statistics determined by unpaired Student’s two sided t test; (a, b, c) Data from 3–5 independent experiments with P values noted in figure.