
Extended Data Fig. 7.
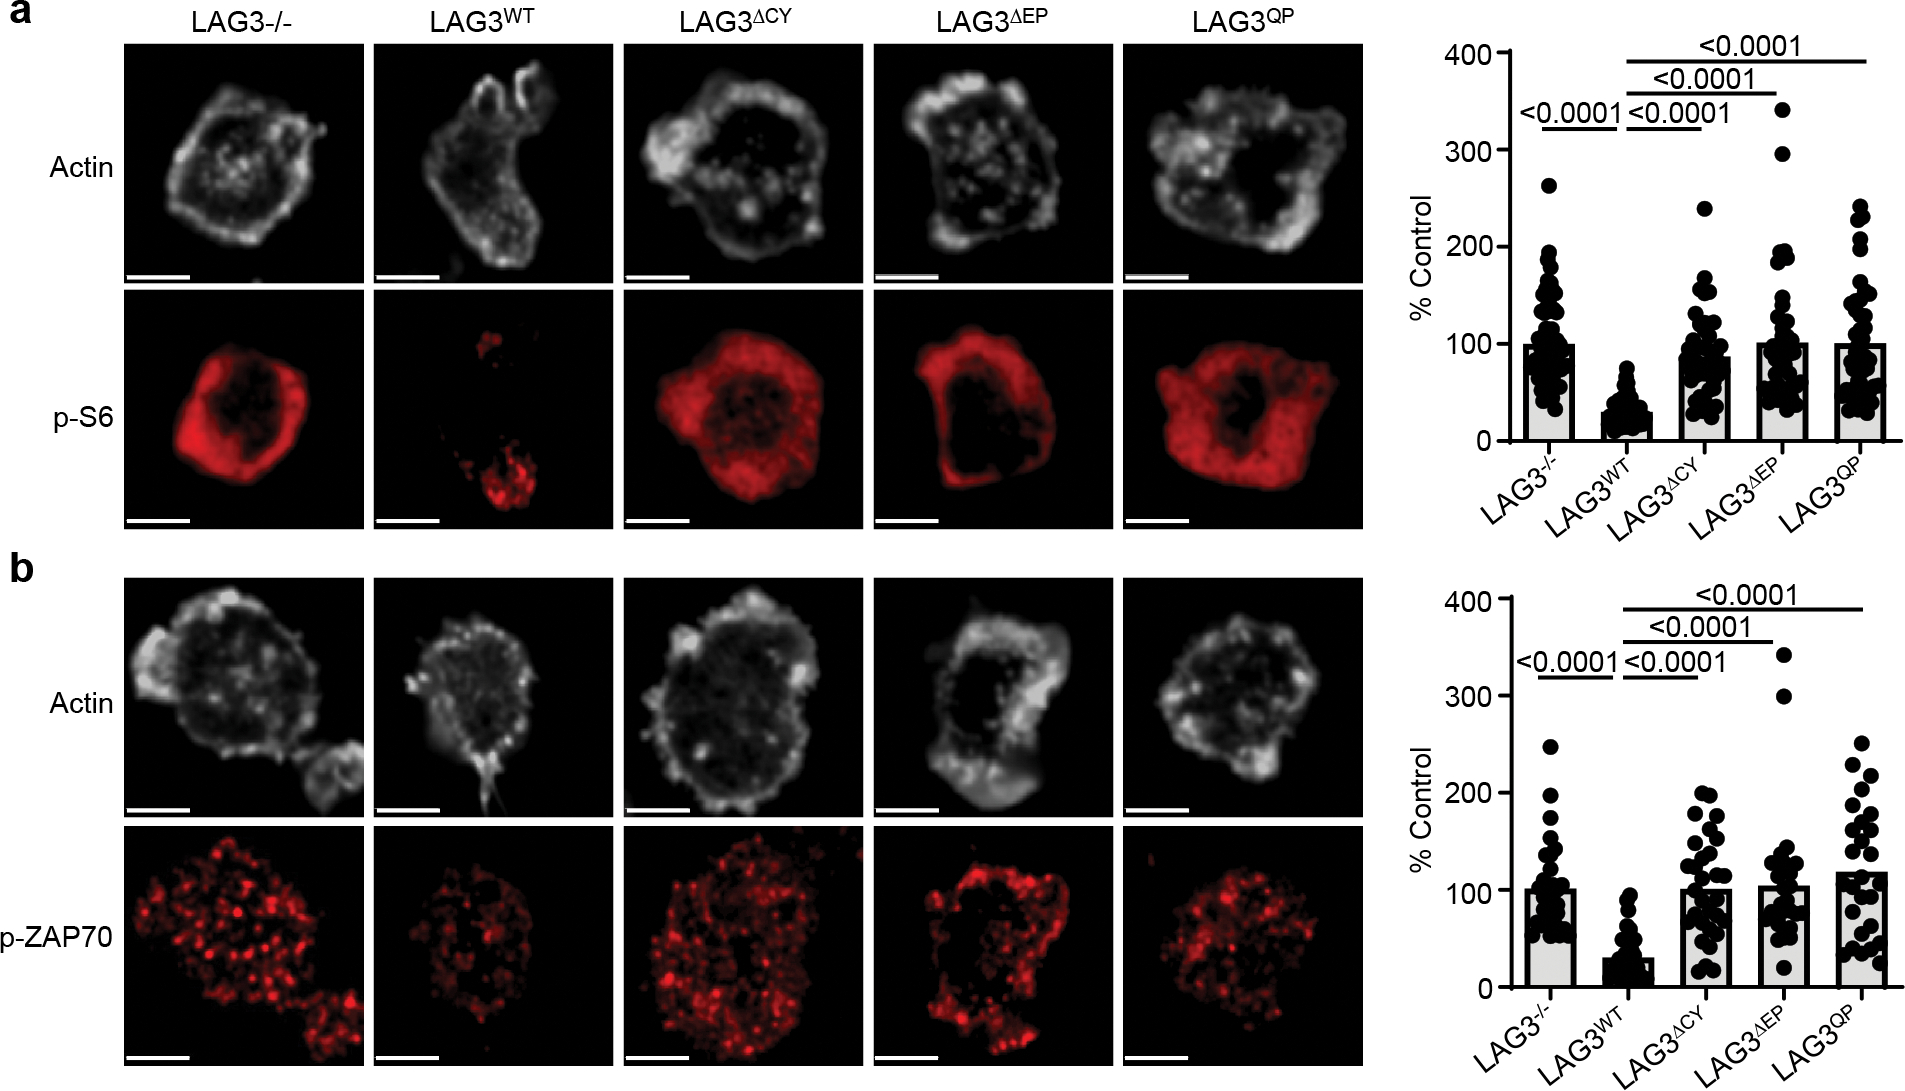
(a, b) Analysis of TCR-induced signaling events in Lag3−/−CD8+ T cells, isolated as above, transduced with LAG3WT or LAG3 functional domain mutants and stimulated with TCRβ Abs. Representative super resolution confocal images are depicted, with quantification of single cell intensity measurements collected from two independent experiments presented as percent of LAG3-deficient parental cells as control (Scale bar 2μm). Statistics determined by unpaired Student’s two sided t test. P values are noted in figures.