
Figure 2. LAG3 associates with the TCR-CD3 complex.
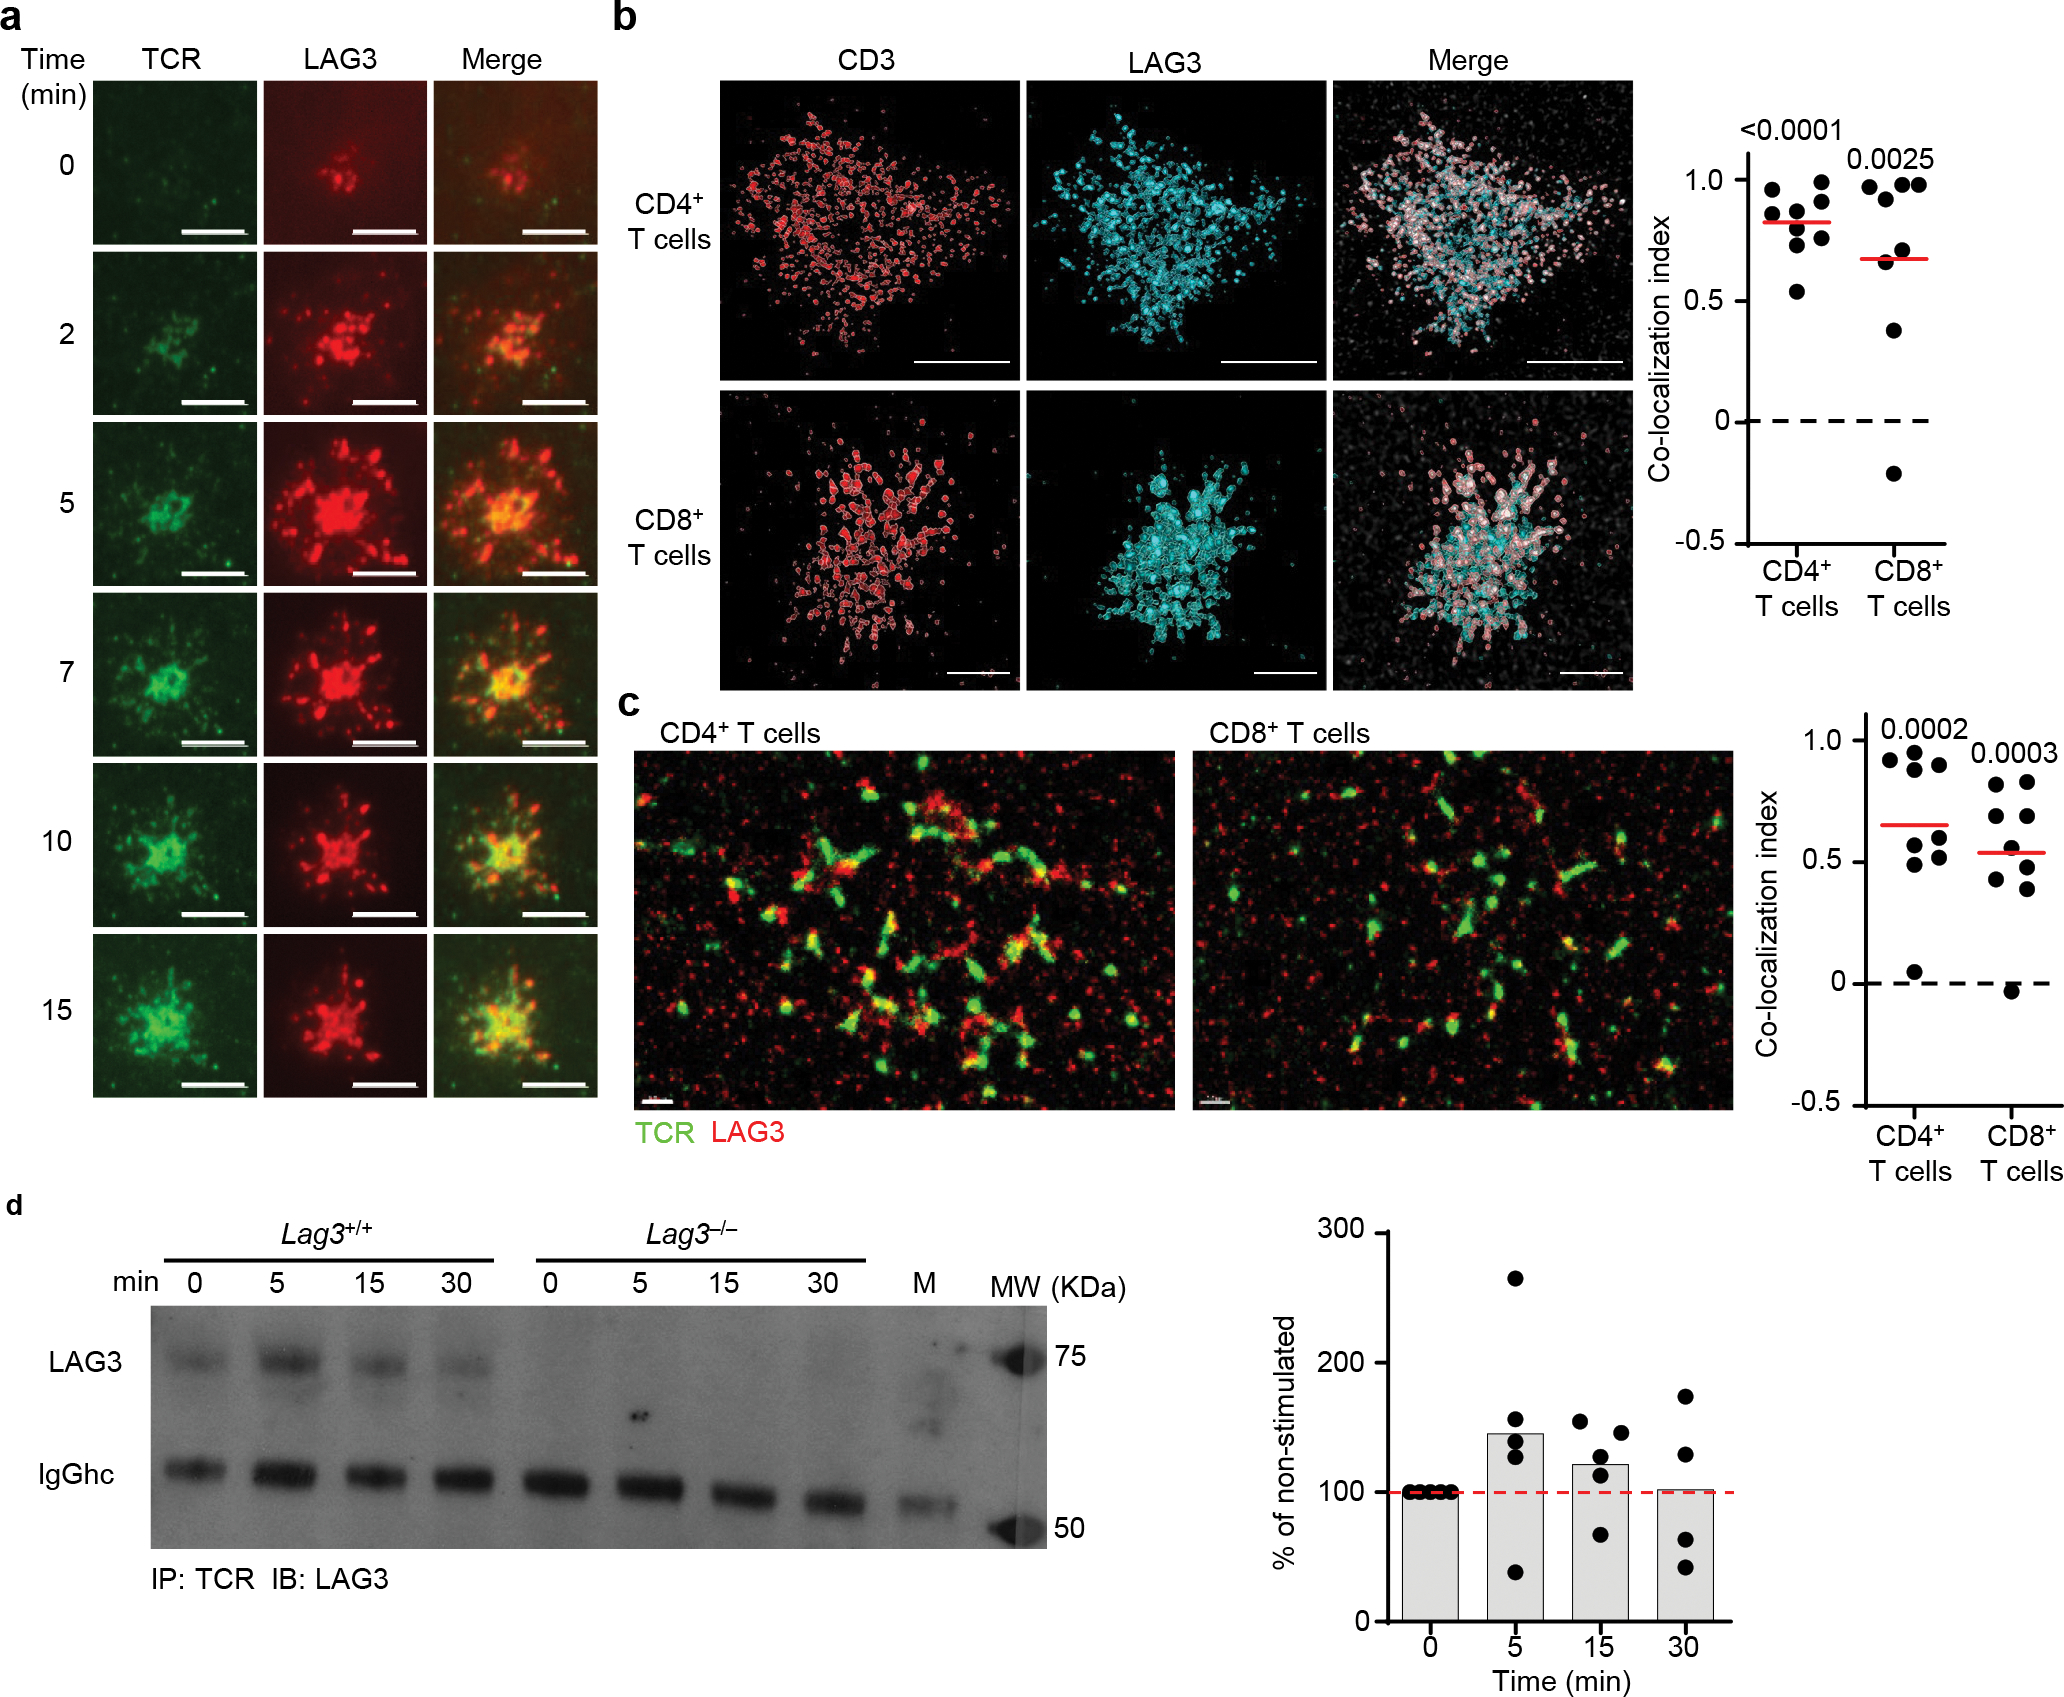
(a) TIRFM visualizing LAG3 (red) and TCR (green) of Lag3−/− CD4+ T cells isolated as above, containing FAP tagged LAG3 stimulated on a planar lipid bilayer with TCRβ Ab for 15 minutes (Scale bar = 5μm). (b) Representative super resolution STED of molecular distribution of TCR and LAG3 determined in CD4+ and CD8+ T cells isolated from spleen and lymph nodes of Lag3+/+ mice and stimulated with TCRβ Abs (scale bar = 2μm) with the co-localization index quantified shown. (c) Representative super resolution STORM of molecular distribution of TCR and LAG3 in stimulated CD4+ and CD8+ T cells as above (scale bar = 1μm) with the Co-localization index quantified shown. (d) Co-immunoprecipitation of the TCR-CD3 complex with LAG3 in resting and TCR stimulated Lag3+/+ and Lag3−/− CD4+ T cells, with quantification of 5 separate experiments depicted. Data in (a) is representative of at least 3 independent experiments. Data in (b, c) represents of the mean of 2 independent experiments and statistics determined by Wilcoxon matched pairs signed rank test with P values noted in figure. Data in (d) represents of the mean of 5 independent experiments.