
Figure 3. LAG3 association with the TCR-CD3 complex increases LAG3 proximity to the co-receptors.
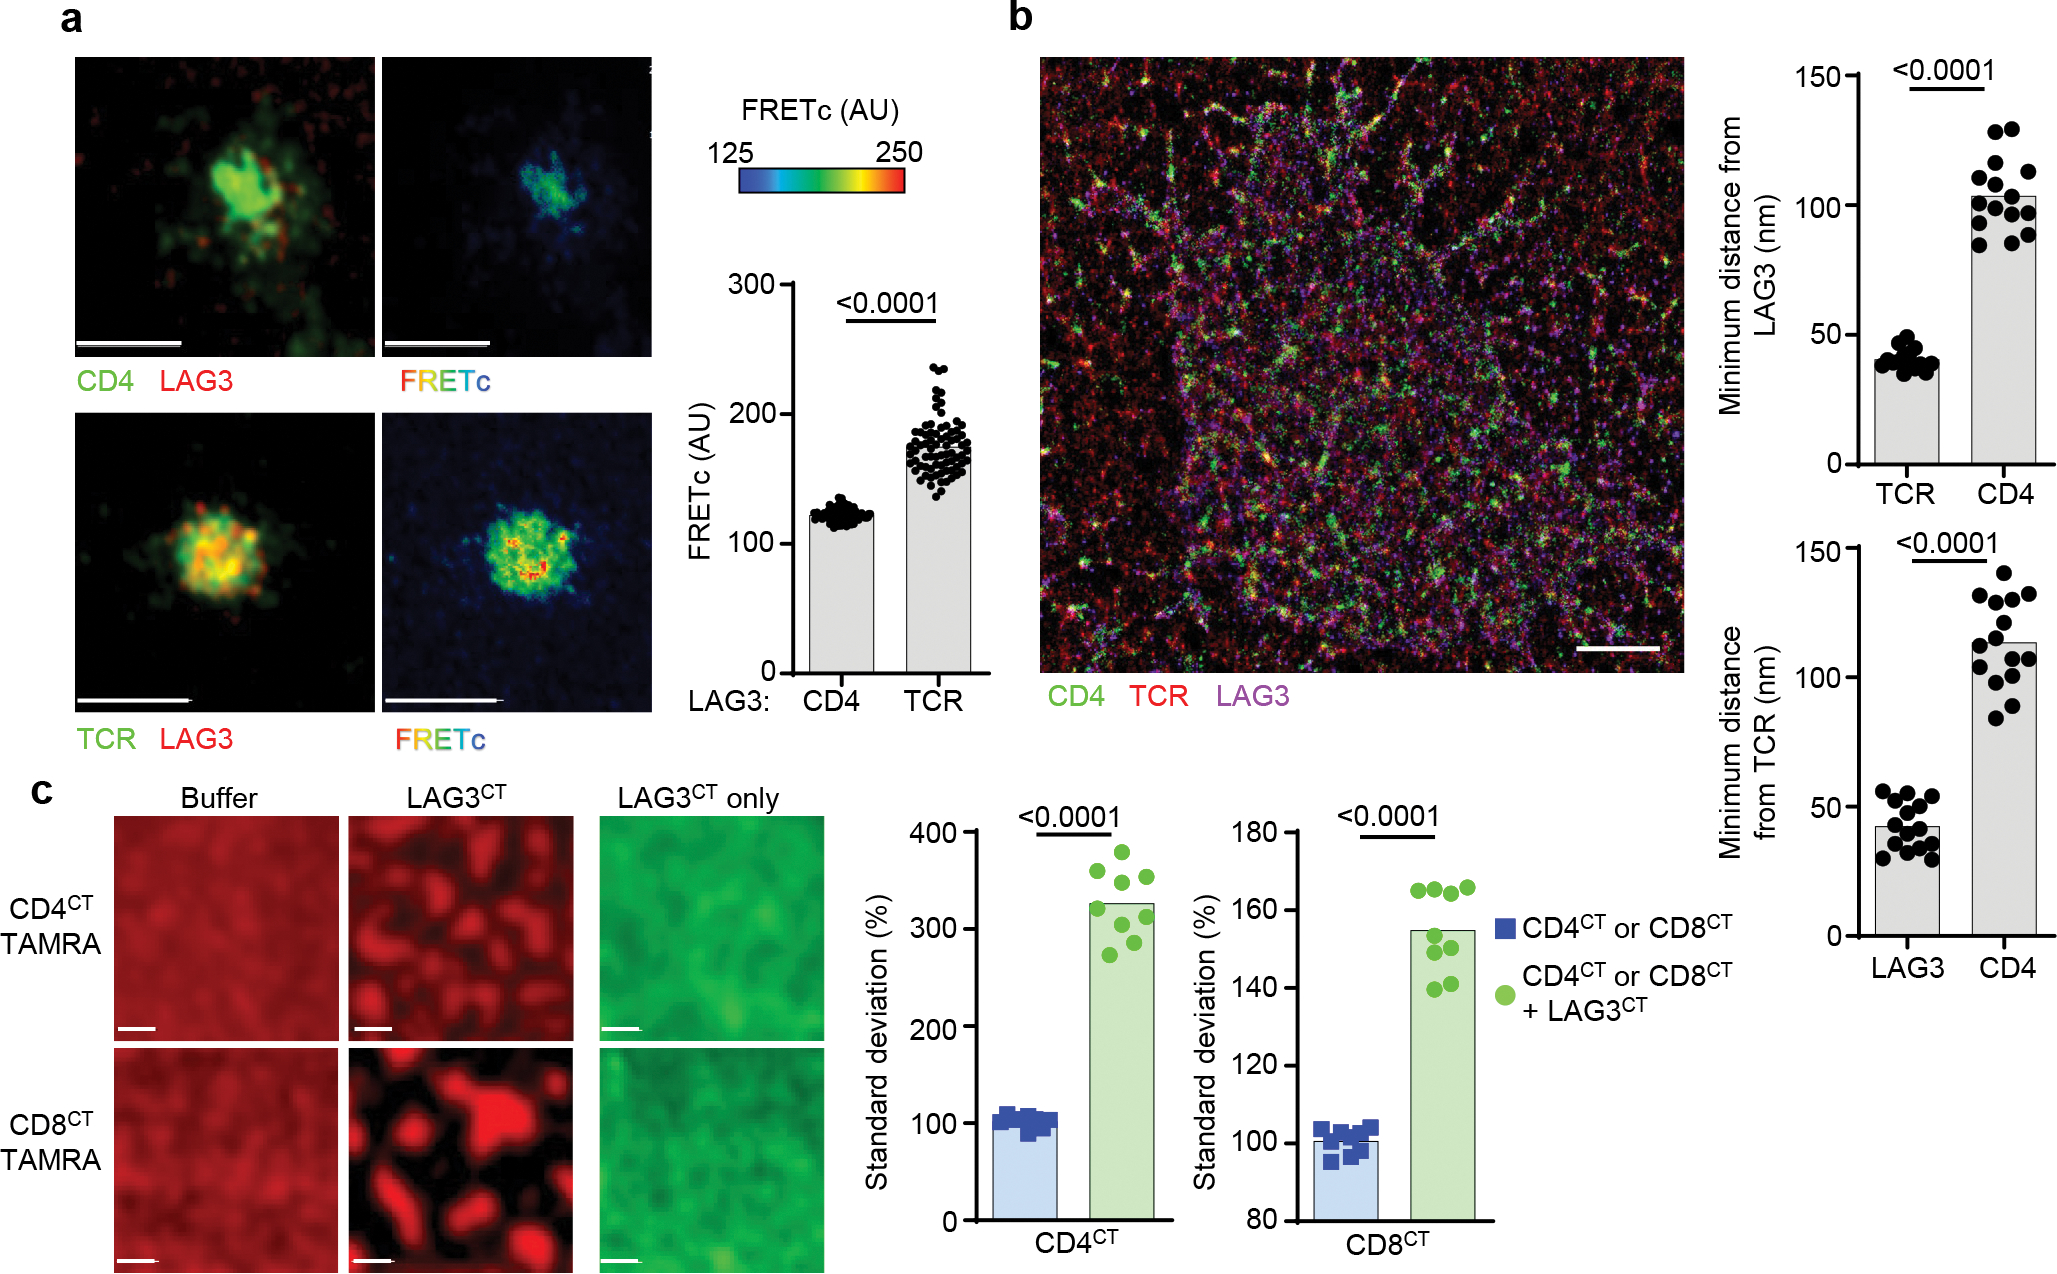
(a) Dynamic association of LAG3, TCR and CD4 on Lag3+/+ CD4+ T cells stimulated with TCRβ Ab using sensitized emission FRET with quantification shown (Scale bar = 5μm). (b) Representative super resolution STORM of molecular distribution of CD4, LAG3 and TCR within the IS determined in CD4+ T cells isolated from spleen and lymph nodes of Lag3+/+ mice and stimulated with TCRβ Abs. Three-dimensional intermolecular analyses of STORM molecule data and the median shortest distance from LAG3 to TCR and CD4 (top) or TCR to LAG3 and CD4 (bottom) (scale bar = 1μm). (c) Representative confocal image of phase separation assay using lipid bilayers containing TAMRA labeled CD4CT or CD8CT in the presence or absence of LAG3CT, with LAG3CT labeled with AF647 to visualize as a control (scale bar = 1μm). Quantification of phase separation assay with standard deviation as a measure of homogeneity. Data in (a, b and c) represent analyses from at least 3–4 independent experiments and statistics determined by unpaired Student’s two-sided t test or Wilcoxon matched pairs signed rank test with P values noted in figure.