
Figure 4. LAG3 association with the TCR-CD3 complex increases LAG3 proximity to the co-receptors.
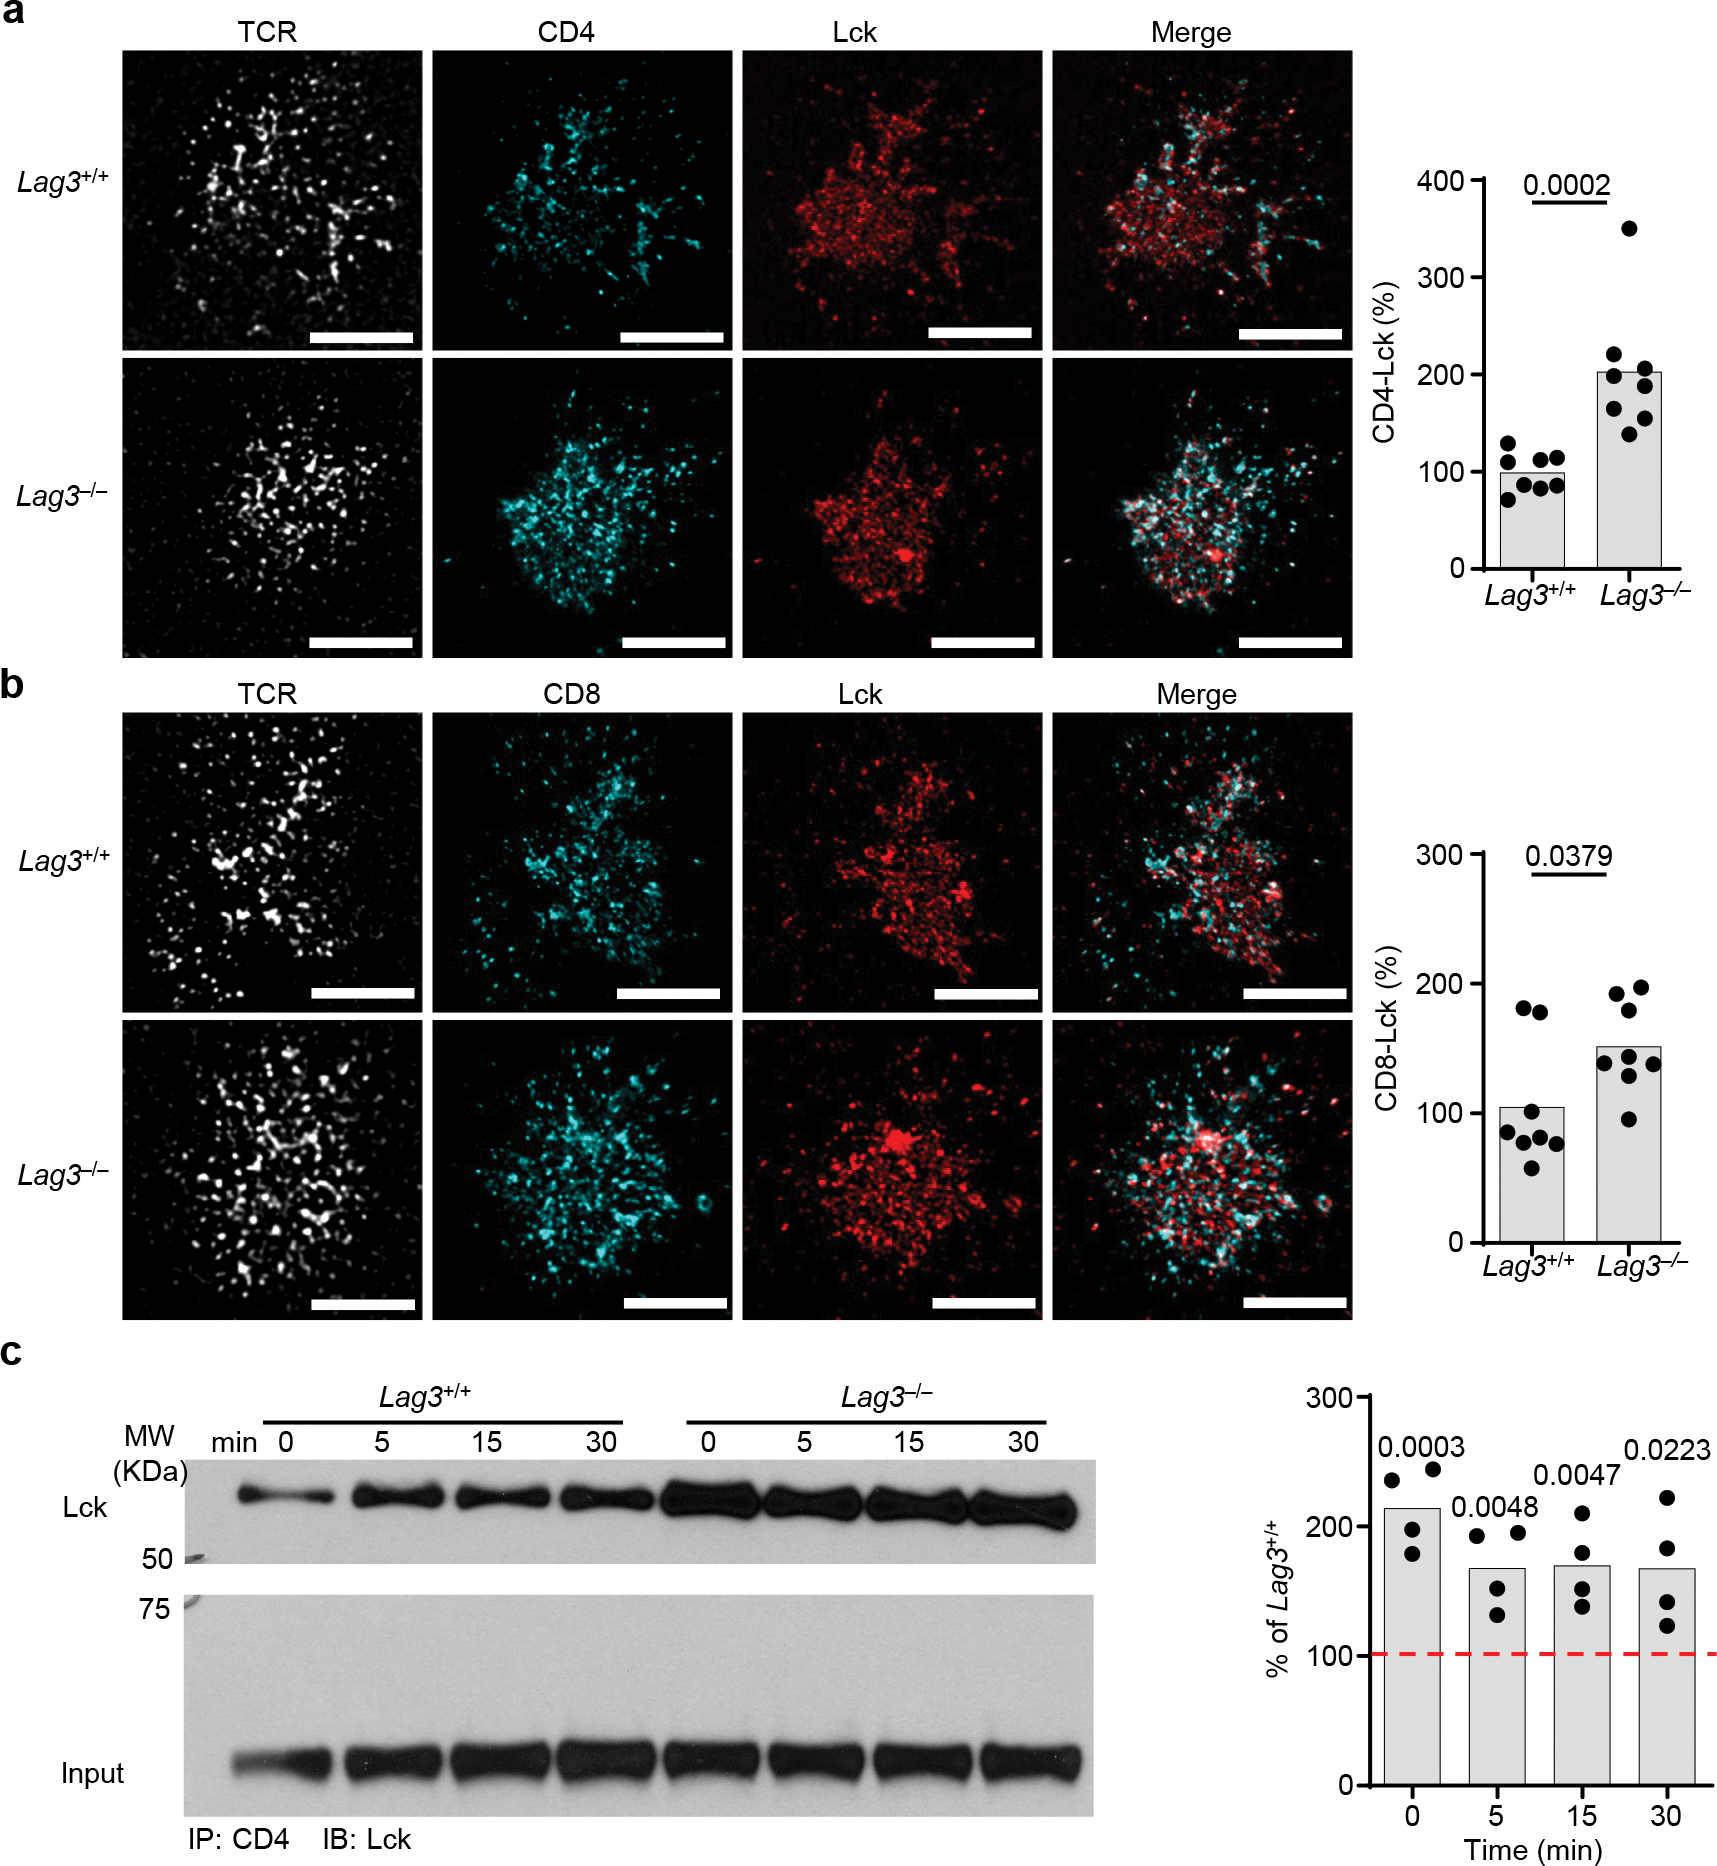
(a,b) Representative super resolution STED of association of Lck with CD4 and CD8 coreceptors in CD4+ or CD8+ T cells isolated from the spleen and lymph nodes of LAG3+/+ and LAG3−/− mice with quantification of their association shown (Scale bar = 2μm). (c) Co-immunoprecipitation western blot analyses of Lck with CD4 in CD4+ or CD8+ T cells isolated from the spleen and lymph nodes of LAG3+/+ and LAG3−/− mice, with quantification shown. Data in (a-c) represent analyses from at least 3–4 independent experiments and statistics determined by unpaired Student’s two-sided t test or (c) Wilcoxon matched pairs signed rank test with P values noted in figure.