


Figure 6. LAG3 dissociates Lck from CD4 by lowering the local pH at the IS.
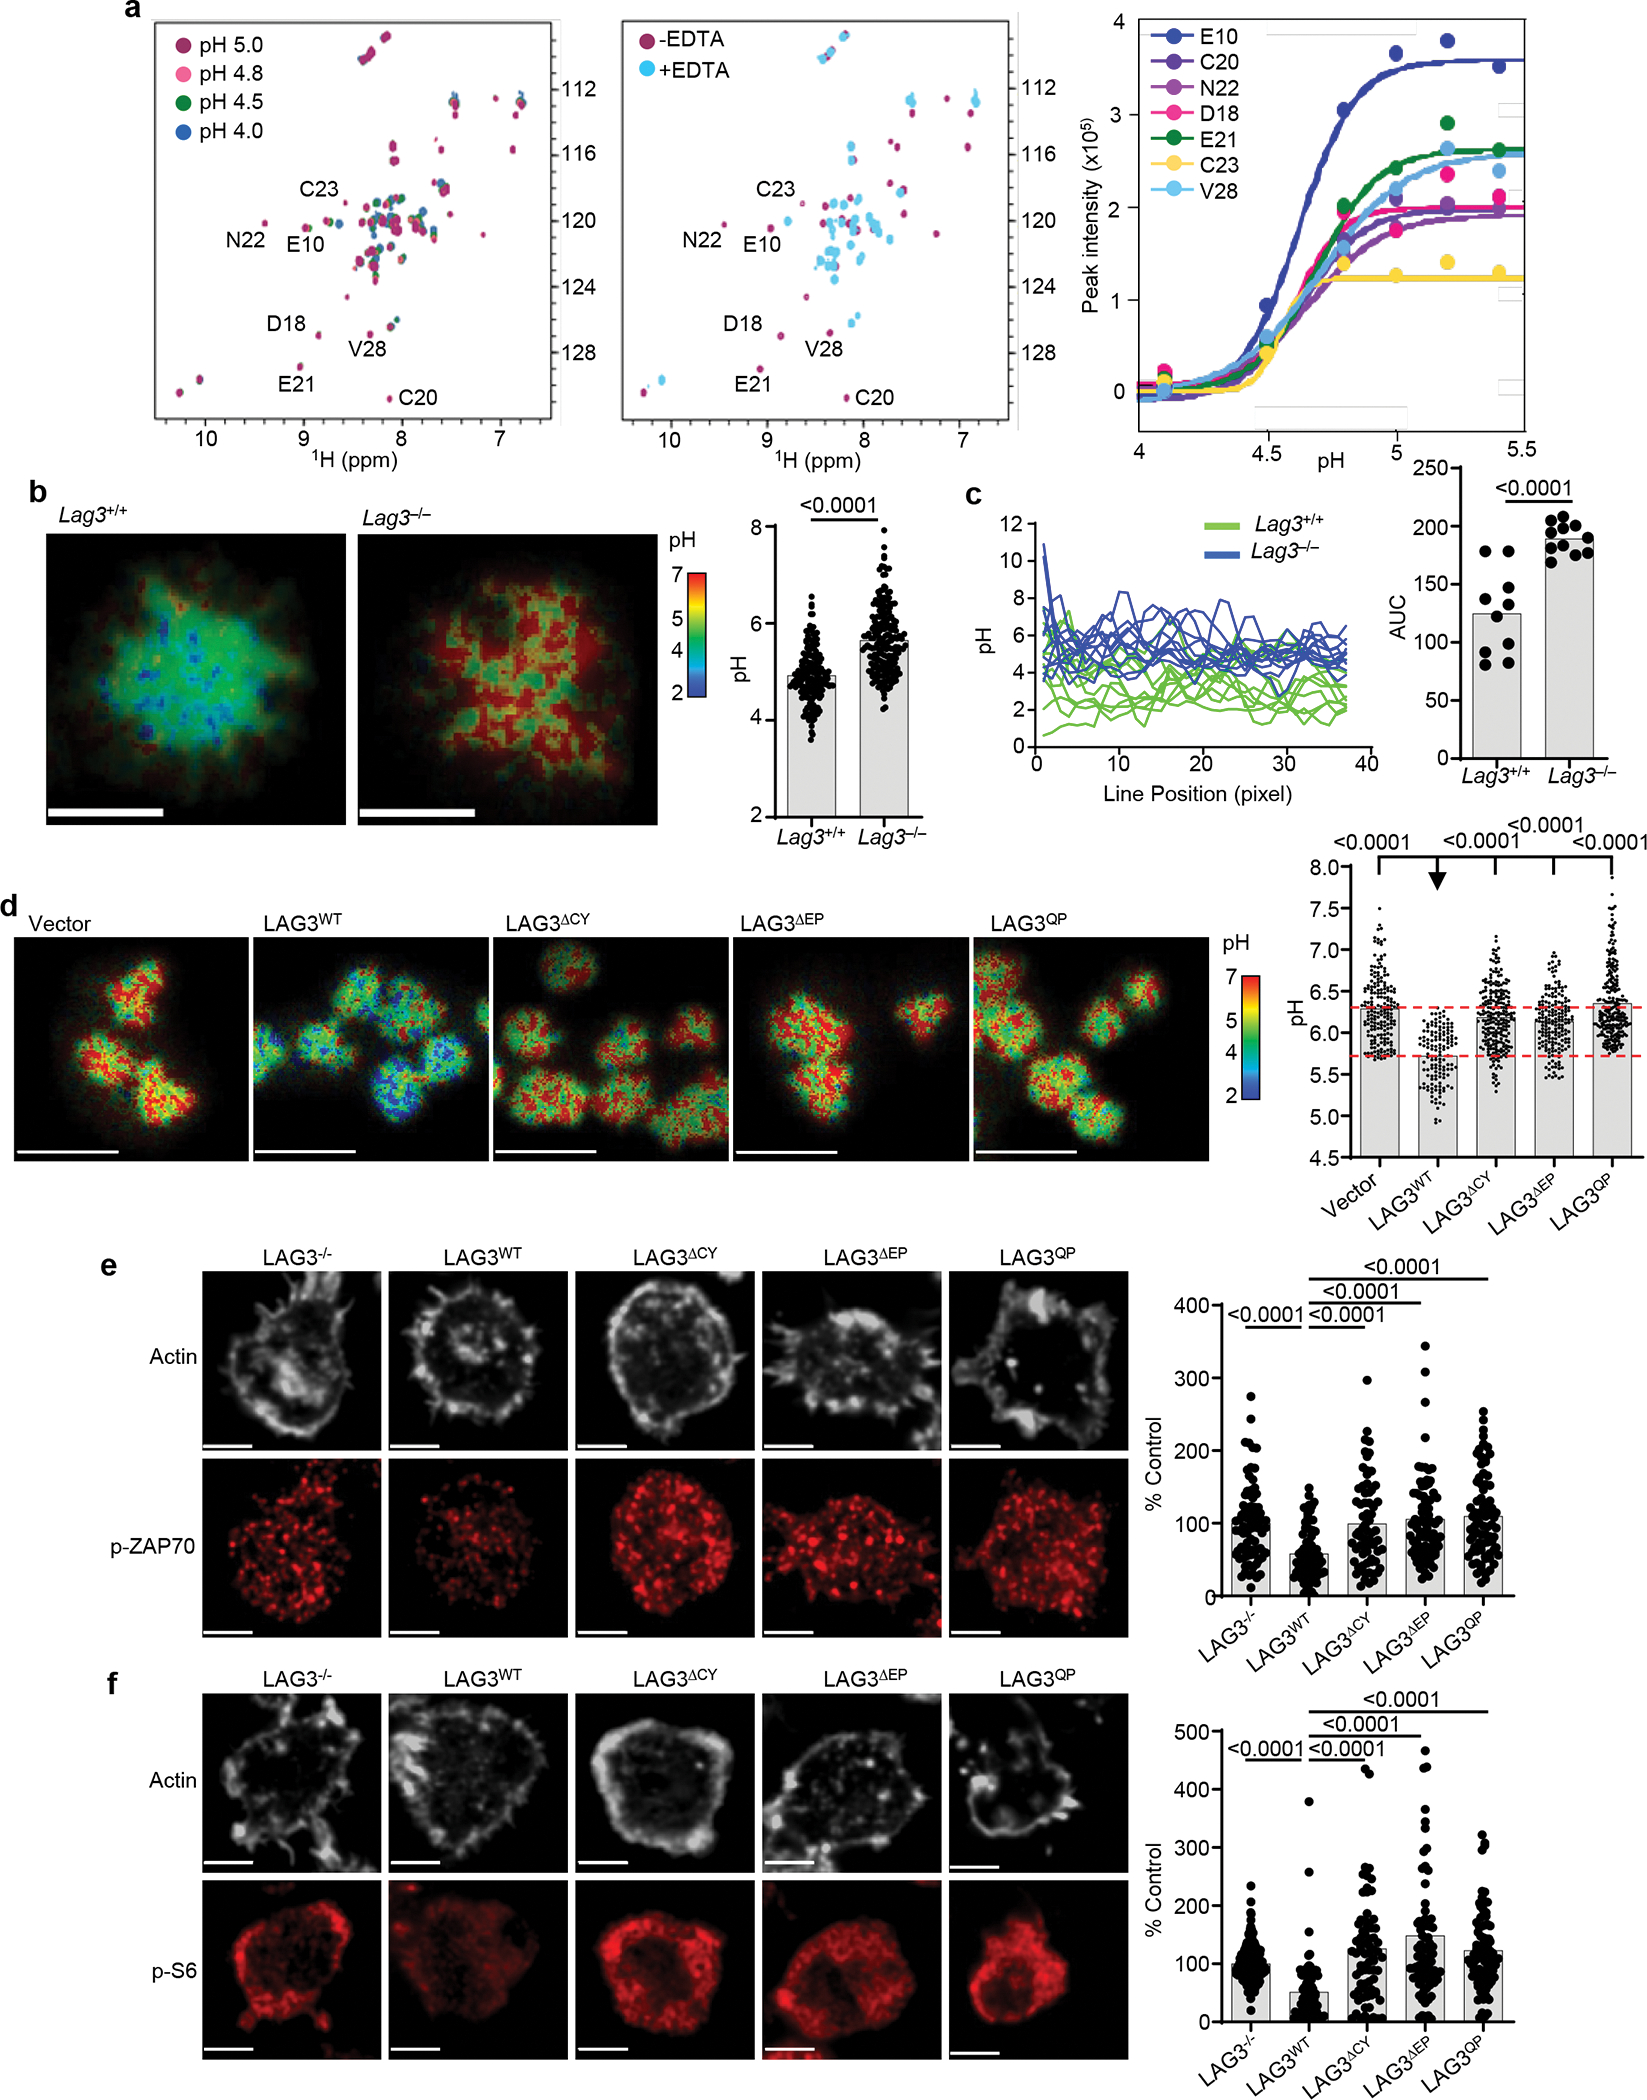
(a) Analyses of CD4-Lck complex formation evaluated by 2D NMR under conditions of varying pH, using the 1H/15N HSQC spectra of a 50 μM 1:1 complex 15N-Lck:CD4CT in the presence of 1.2 molar equivalents of Zn2+ with addition of EDTA as control. Right: pH-dependent changes in the peak intensity for selected residues normalized to their intensity in the spectrum of the fully folded complex. (b) Representative confocal FLIM images of BCECF-labeled CD4+ T cells isolated from spleen and lymph nodes of Lag3+/+ and Lag3−/− mice to determine the intracellular membrane-proximal pH by fluorescent lifetime imaging following stimulation with TCRβ Abs with quantification of membrane-proximal pH of individual cells. Scale bar 5μm. Data are replicates from 3 separate experiments. (c) pH values determined for each pixel along a line drawn through the center of the contact area with quantification of the area under the curve determined. (d) Representative confocal FLIM images of BCECF-labeled Lag3−/− CD4+ T cells transduced with LAG3 and mutants following stimulation with TCRβ Abs with quantification shown. Scale bar 10 μm. Data are replicates from 3 separate experiments. (e, f) Representative super resolution confocal images of TCR-induced signaling events in Lag3−/−CD4+ T cells, isolated as above, transduced with LAG3WT or LAG3 functional domain mutants and stimulated with TCRβ Abs. Single cell intensity measurements collected from two independent experiments presented as percent of LAG3-deficient parental cells as control. Scale bar 2μm. Data represent mean of replicate measurements from at least 2 separate experiments. Data shown for individual cells (b, e) and statistical analysis performed using unpaired Student’s two-sided t test with P values noted in figure.