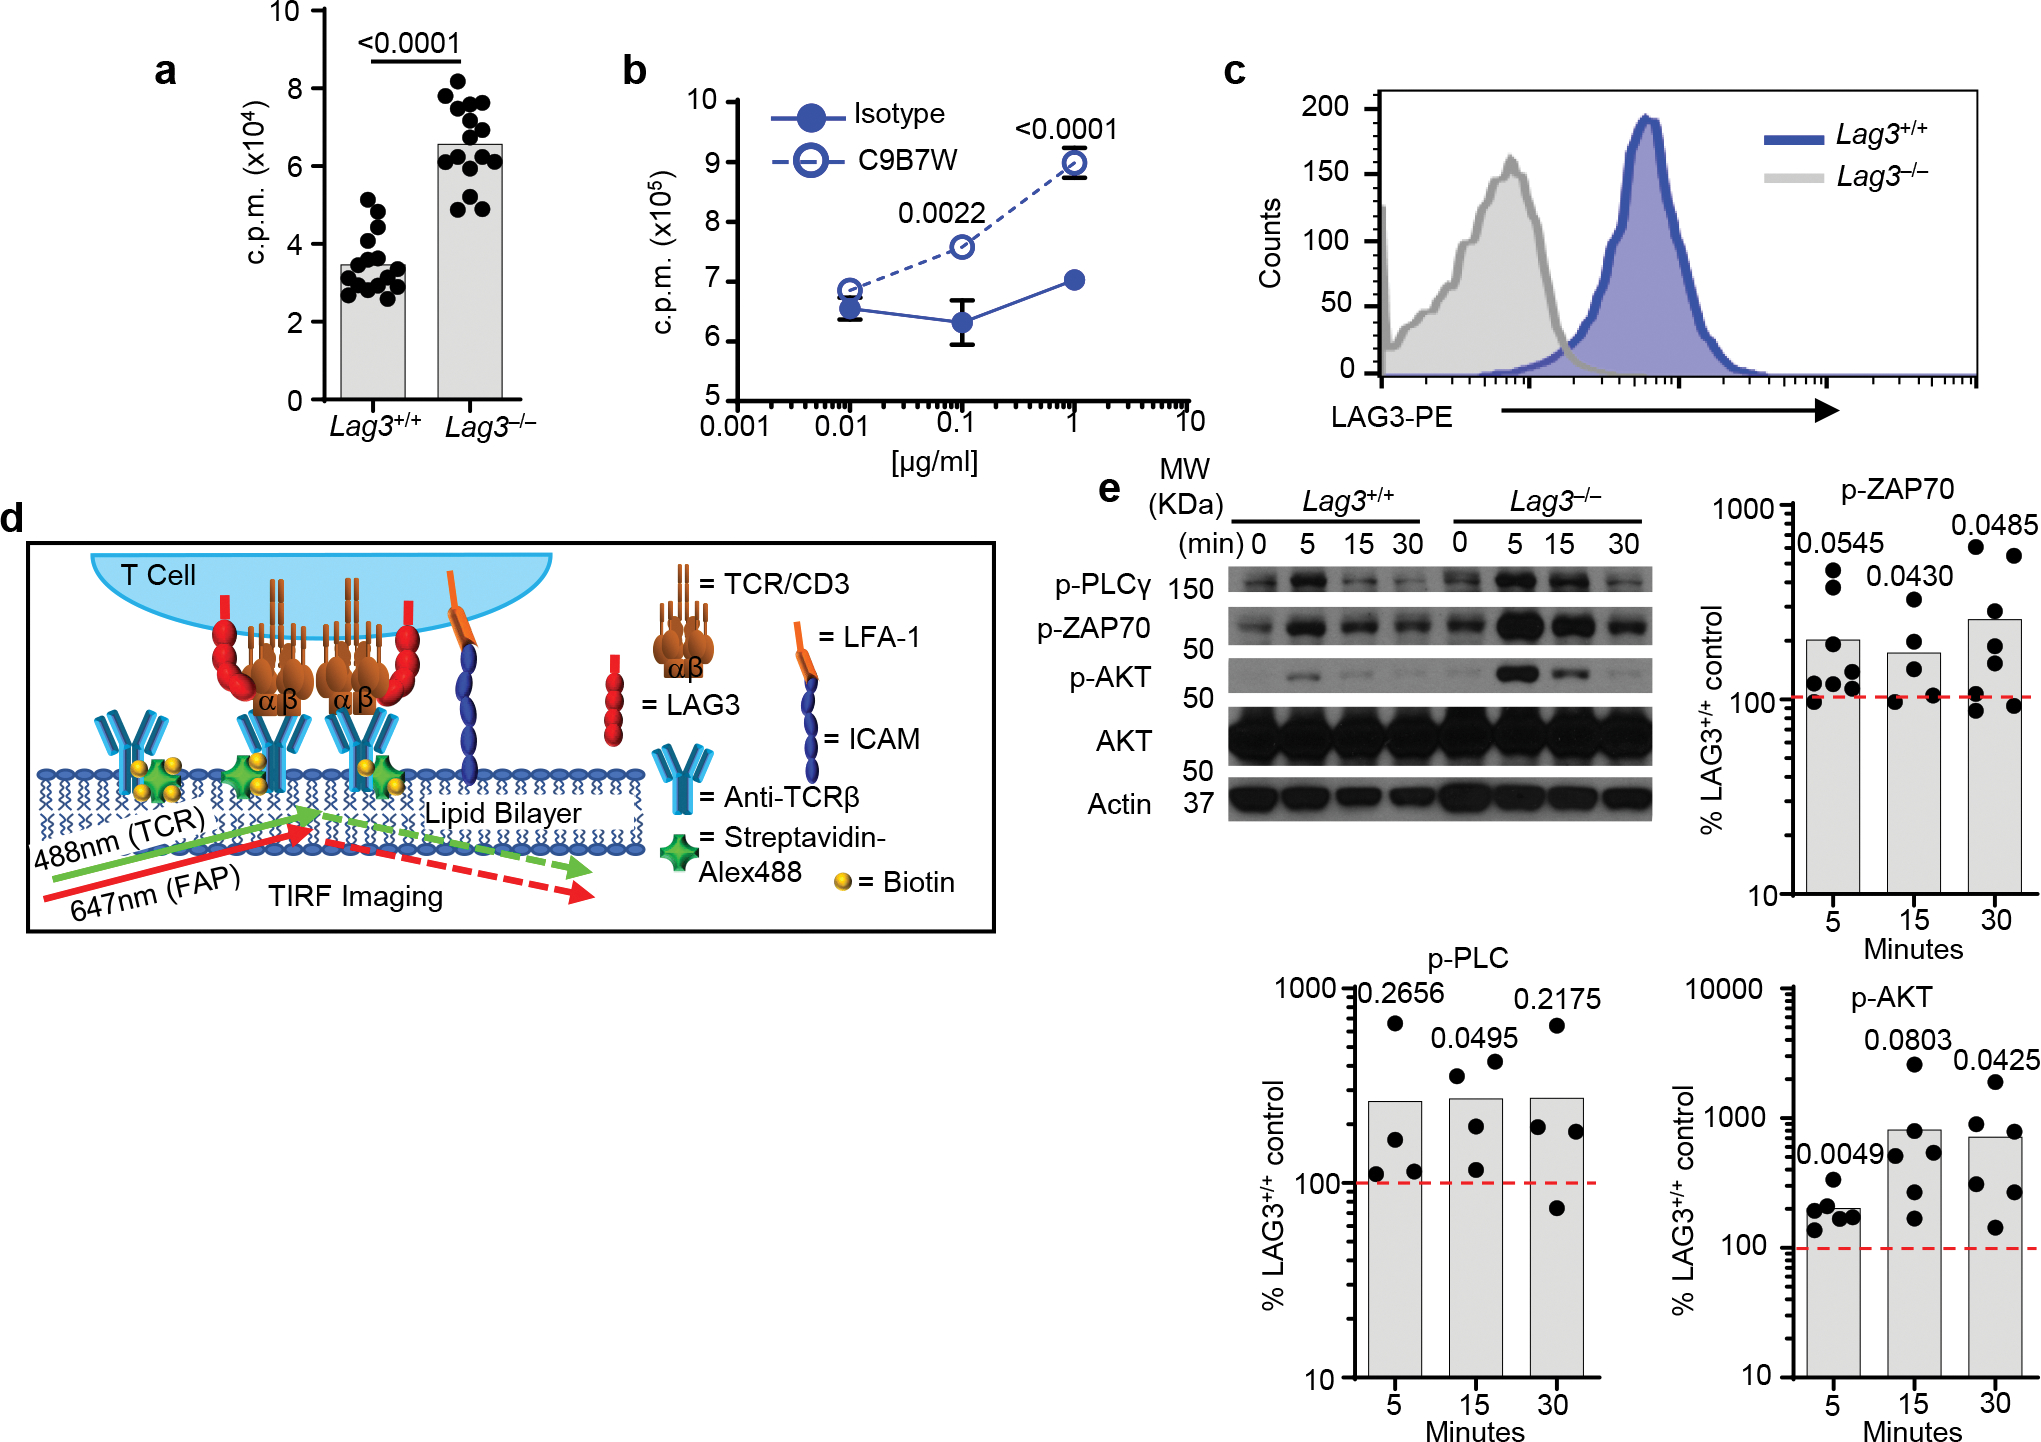
Extended Data Fig. 1.

(a) Thymidine incorporation proliferation assay with purified CD4+ T cells from spleen and lymph nodes of LAG3+/+ and LAG3−/− mice stimulated with plate bound CD3ε and CD28 Abs for 72h in the absence (a) or presence of isotype control or anti-LAG3 blocking antibodies (b). (c) LAG3 expression of LAG3+/+ CD4+ T cells, isolated as above following activation with CD3ε and CD28 Abs at 48hr. Cells were gated on a live lymphocyte gate, and CD4. (d) Diagram depicting TIRF microscopy analysis on stimulating lipid bilayer. (e) Western blot analysis and quantification of TCR–proximal signaling events in Lag3+/+ or Lag3−/− CD4+ T cells stimulated for 48 hr with CD3ε and CD28 Abs to induce LAG3 expression, allowed to rest in the presence of IL-2 and then re-stimulated for 5, 15 and 30 min with anti-CD3. Quantitation determined by percent density of Lag3−/− compared to Lag3+/+. Data in (a) represents the mean of n=16 (LAG3+/+) and n= 16 (LAG3−/−) individual mice. Data in (b) represents the mean of n=6 (LAG3+/+) and n= 6 (LAG3−/−) individual mice. Data in (e) represents the mean of 4–8 individual experiments. Statistical analysis performed using Student’s unpaired two-sided t test with P values noted in figures.
