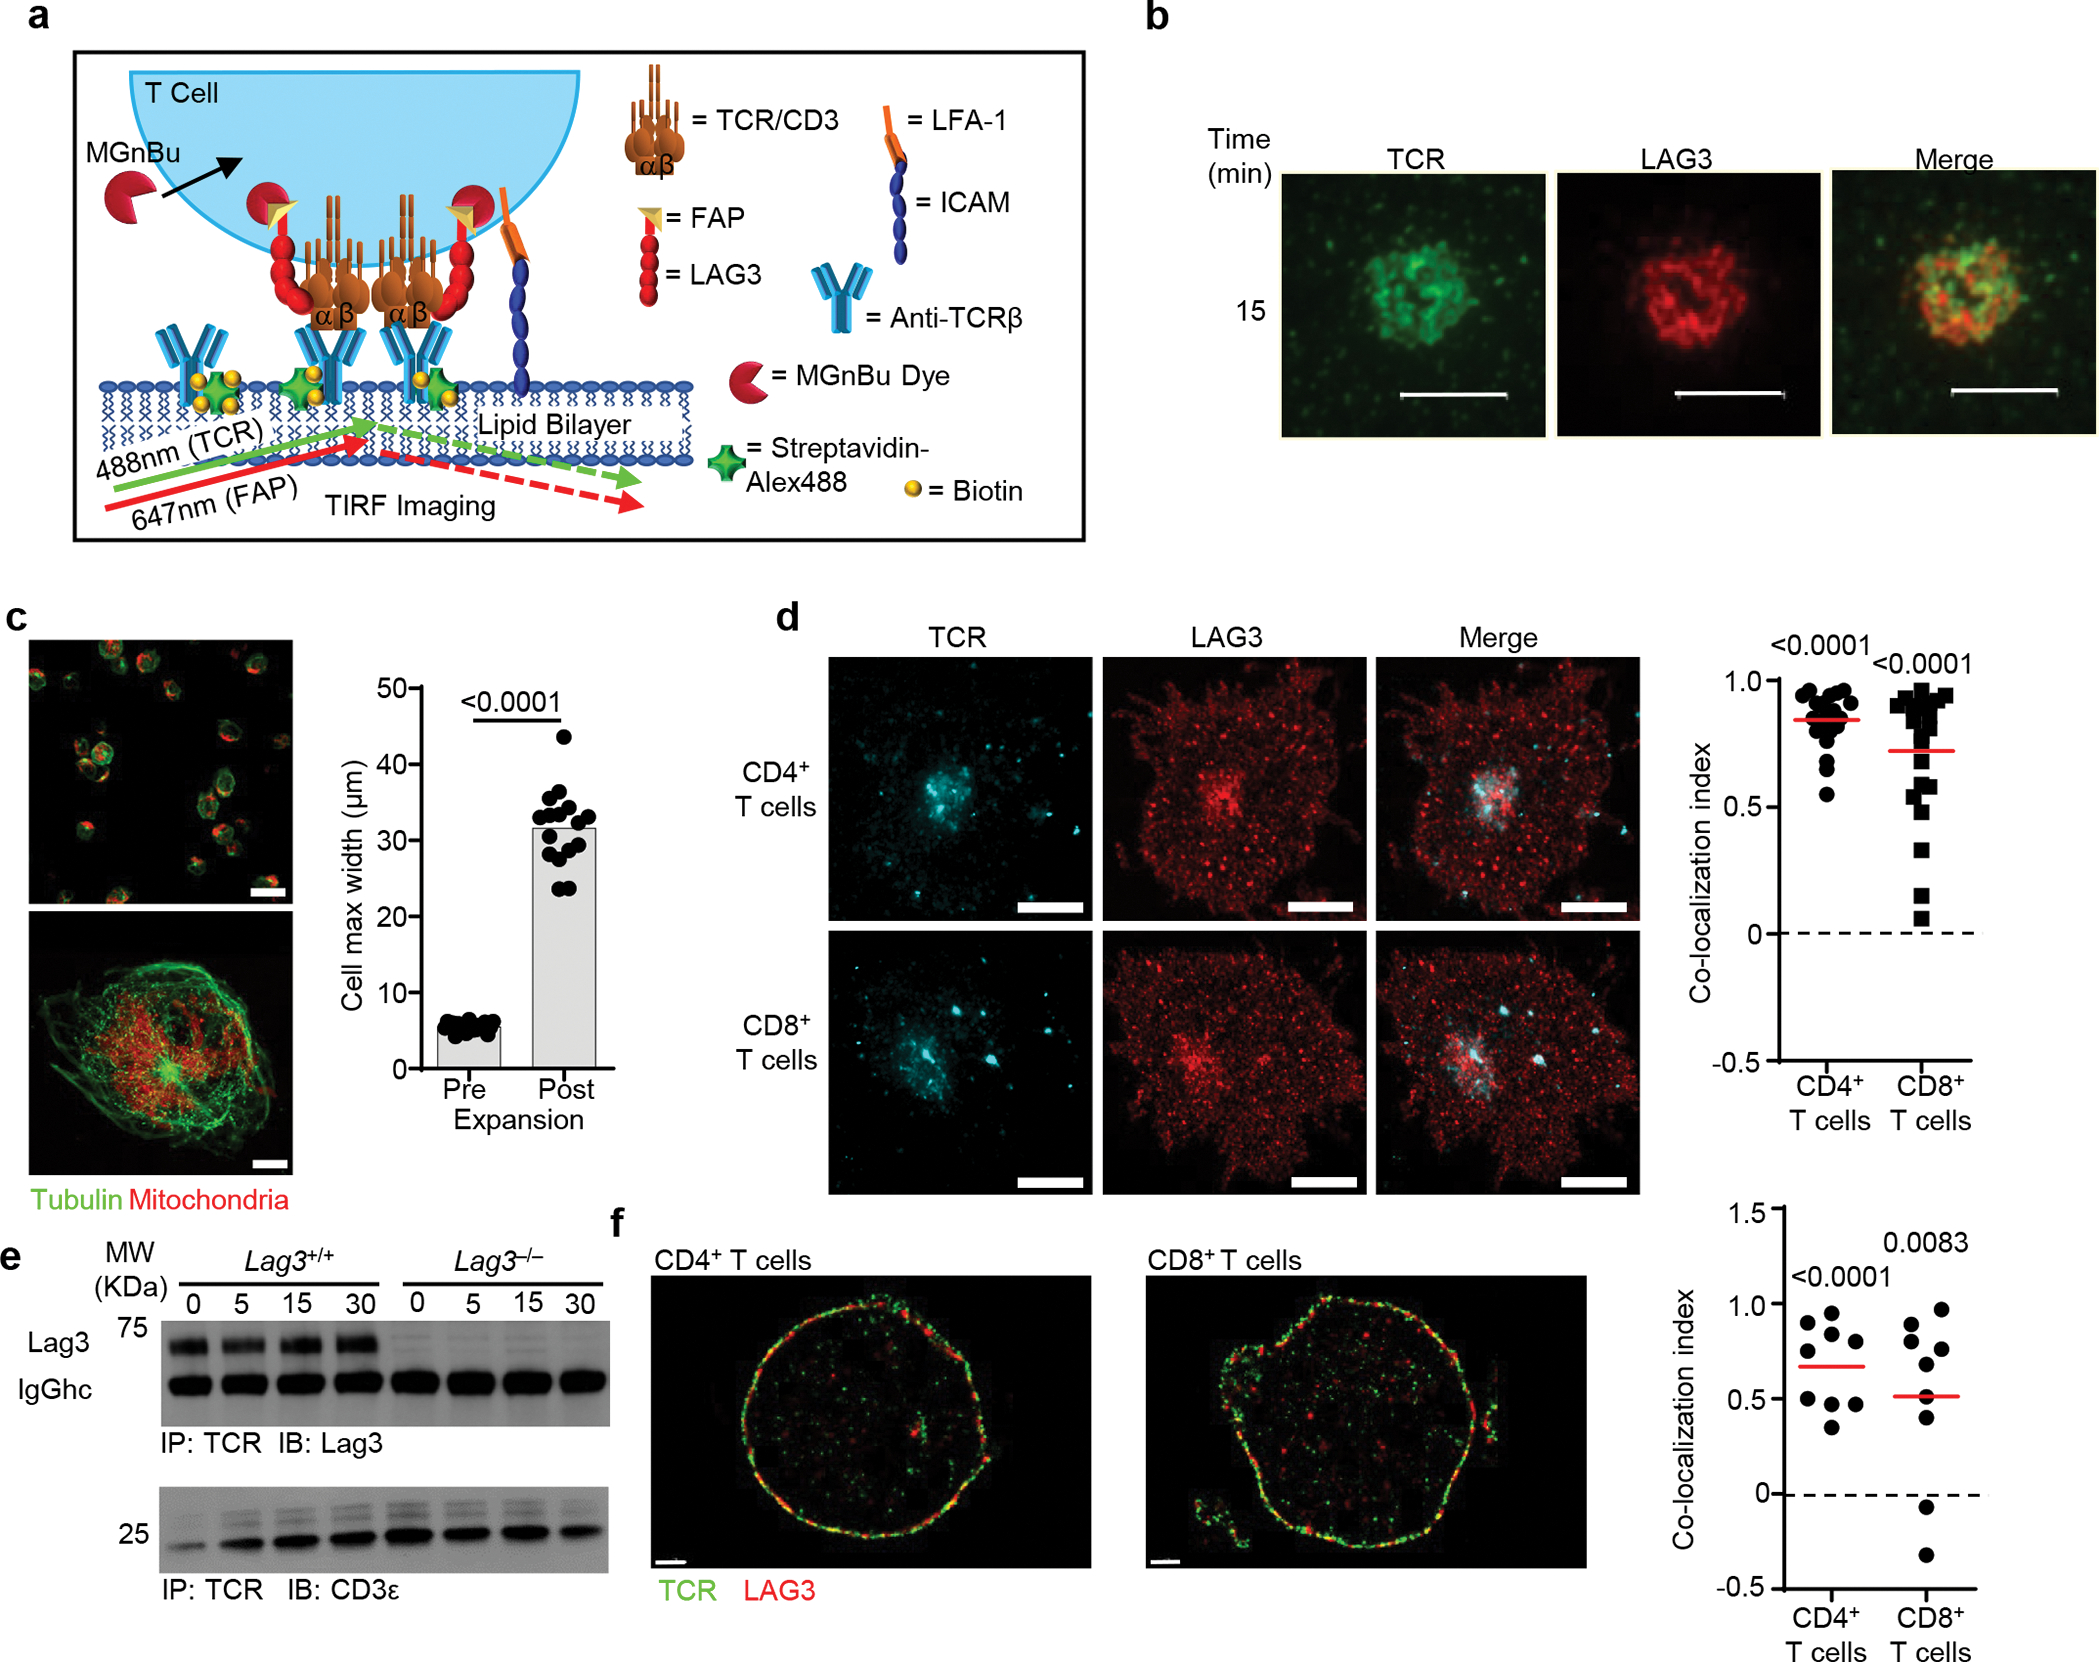
Extended Data Fig. 2.

(a) Diagram depicting TIRF microscopy analysis of Lag3−/− CD4+ T cells containing FAP tagged LAG3 in the presences of MGnBu to visualize the FAP, stimulated on a planar lipid bilayer containing ICAM and biotinylated TCRβ Ab, with streptavidin Alexa 488 to allow for visualization of TCR clustering. (b) Real-time fluorescent TIRFM visualizing LAG3 (red) and TCR (green) of CD8+ T cells, isolated from spleen and lymph nodes of Lag3−/−mice, containing FAP tagged LAG3 stimulated on a planar lipid bilayer containing TCRβ Ab for 15 minutes (Scale bar = 5μm). (c) Activated T cells were immunolabeled for Tubulin (green) and mitochondria (Red) and imaged using 3-dimensional super resolution confocal either pre- (upper) or post-expansion microscopy (lower) and their maximum cell width determined as a measure of fold expansion. (d) Lag3+/+ and Lag3−/− CD4+ and CD8+ T cells, isolated as above, were immunolabeled to detect TCR and LAG3, and subjected to expansion microscopy with the degree of co-localization presented (Scale bar = 10μm). (e) Co-immunoprecipitation of the TCR-CD3 complex with LAG3 in resting Lag3+/+ and Lag3−/− transgenic CD4+ T cells and stimulated in the presence of peptide and MHC class II. (f) Molecular distribution of TCR and LAG3 in non-stimulated Lag3+/+ CD4+ and CD8+ T cells, isolated as above, as determined by STORM with quantification shown on the right (Scale bar = 1μm). Data in (b) and (d) is representative of 3 and 2 independent experiments respectively. Statistics (d, f) was determined by Wilcoxon matched pairs signed rank test or student’s unpaired two-sided t test (c) with P values noted in figures.
