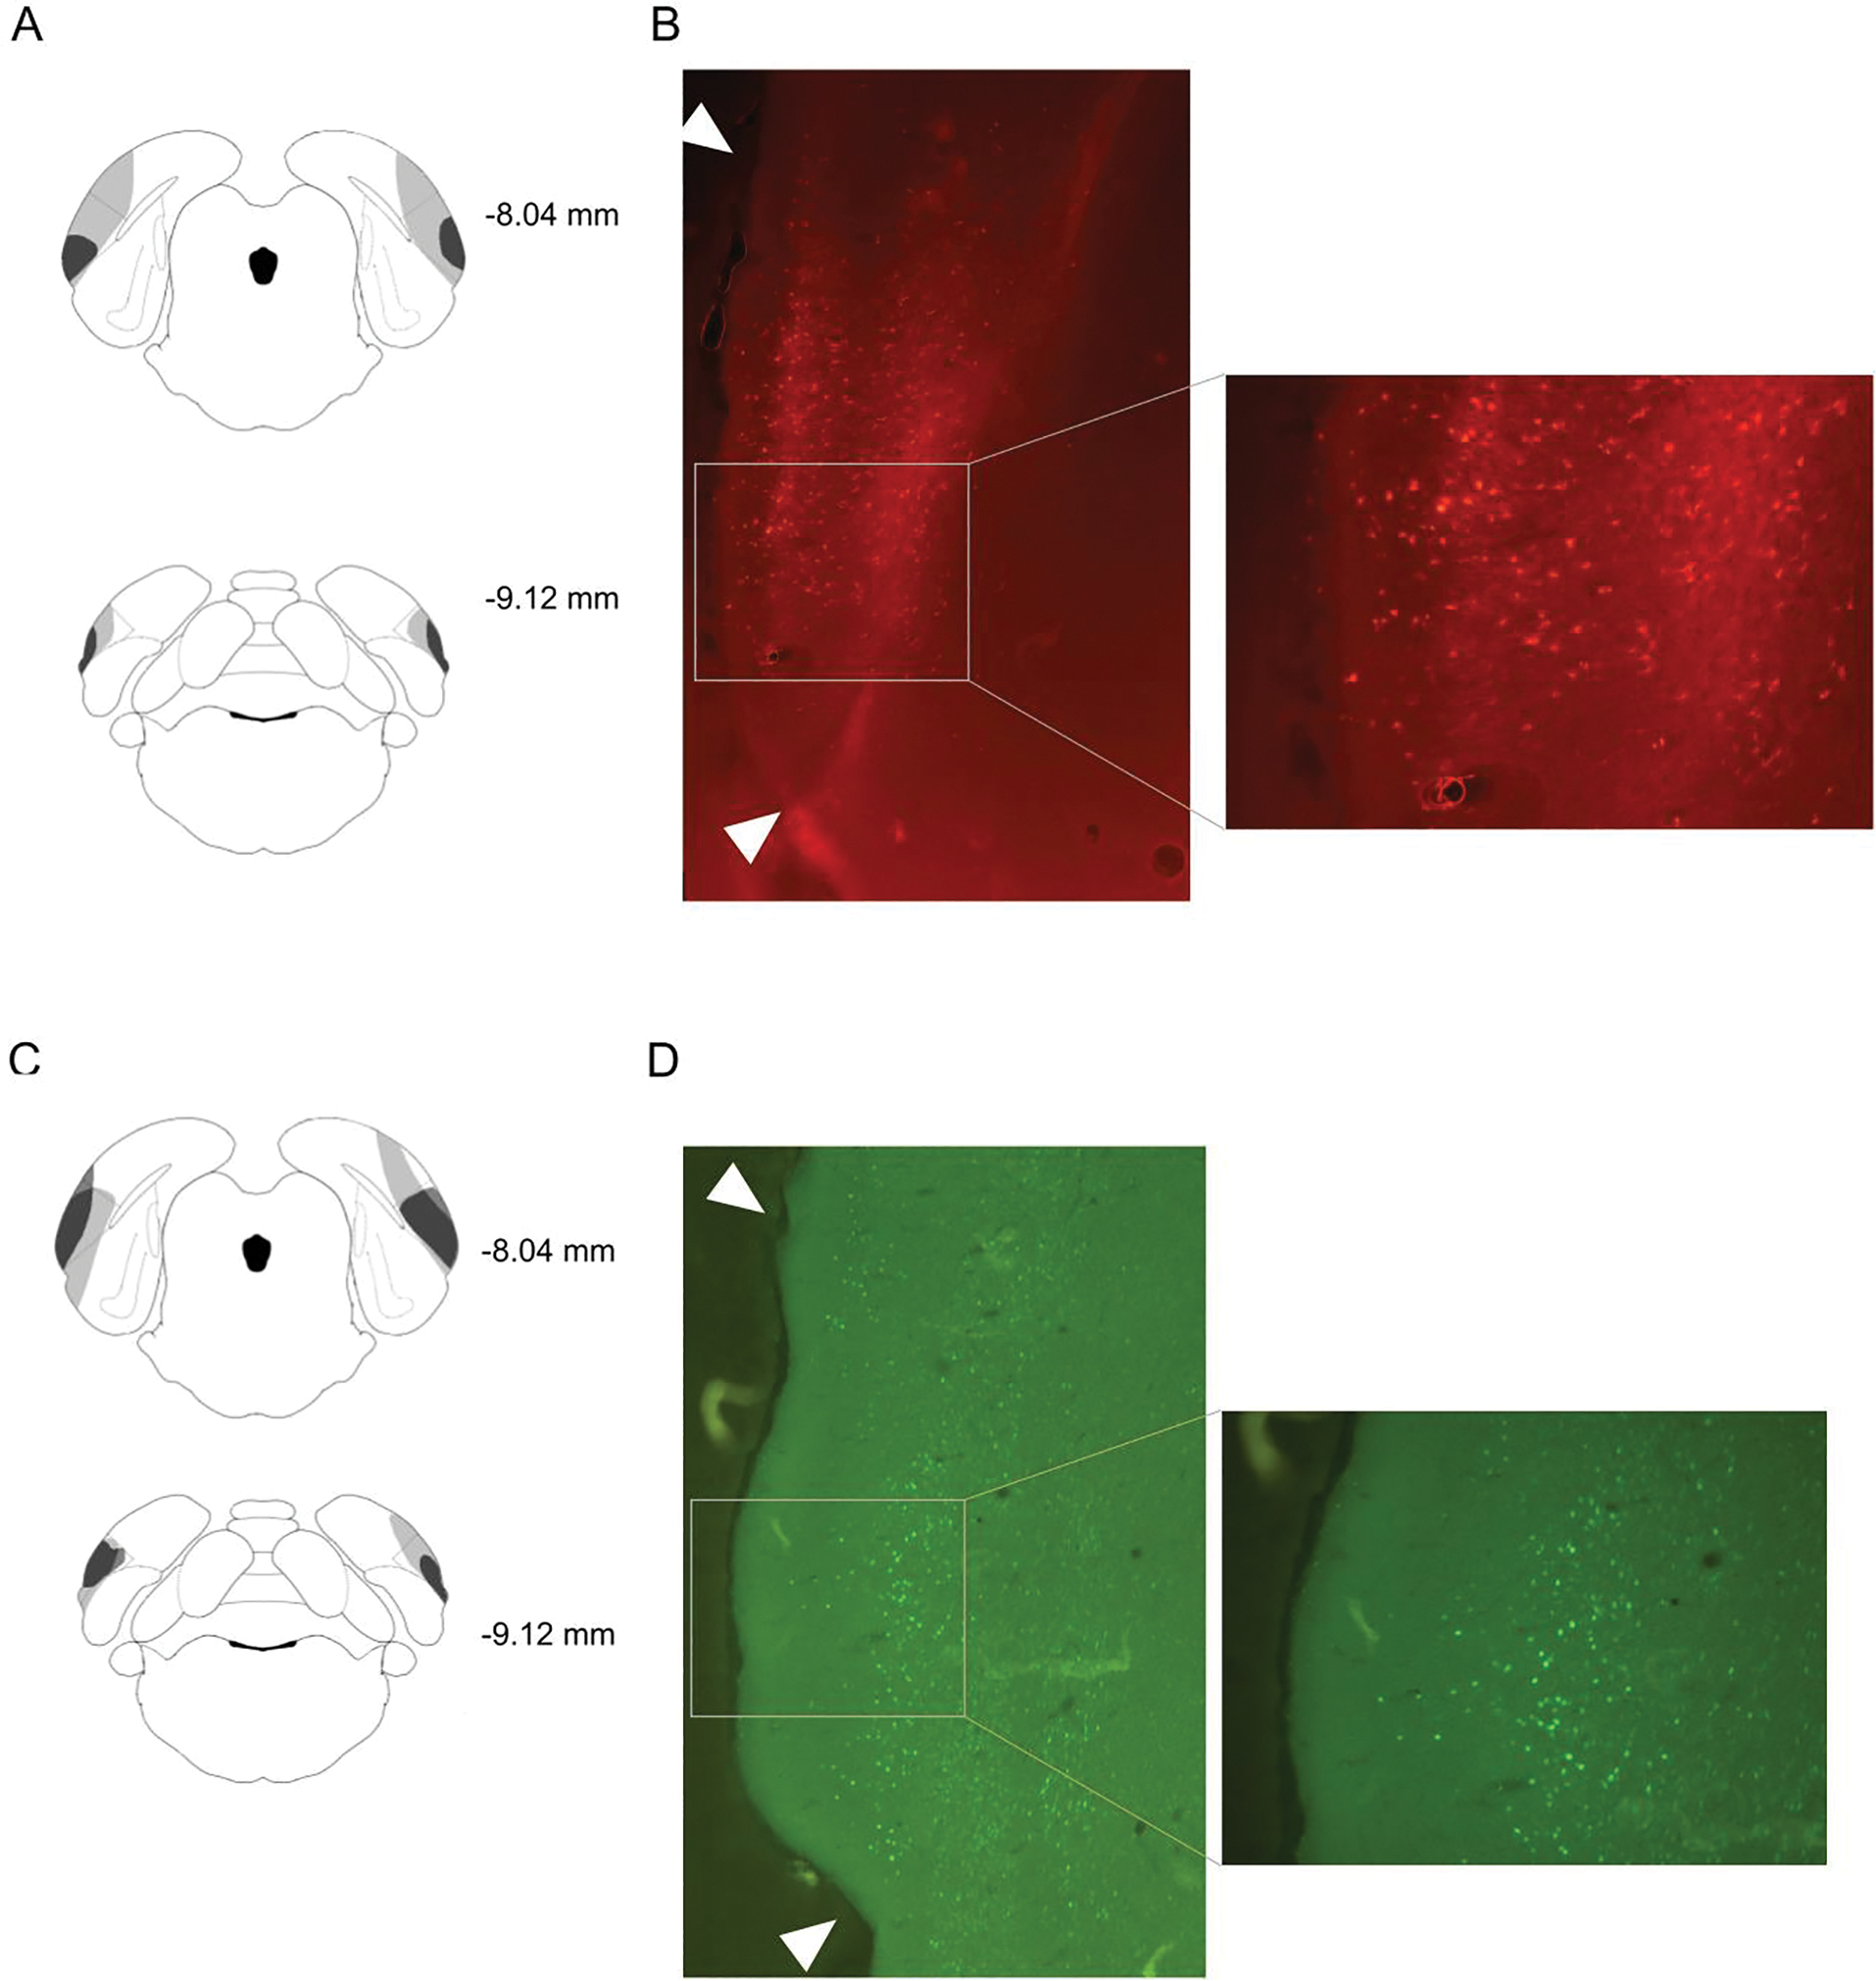
Figure 1.

A: Schematic diagram of representative minimum (dark gray) and maximum (light gray) expression of hM4Di. Lateral dashed lines indicate the boundary of POR. Measurements indicate distance from bregma. B: Representative photomicrographs of fluorescent labeling of POR neurons expressing hM4Di at approximately −8.28mm. Arrowheads indicate the boundary of POR. C: Schematic diagram of representative minimum (dark gray) and maximum (light gray) expression of GFP. D: Representative photomicrographs of fluorescent labeling of POR neurons expressing GFP at approximately −8.28 mm. Arrowheads indicate the boundary of POR.
