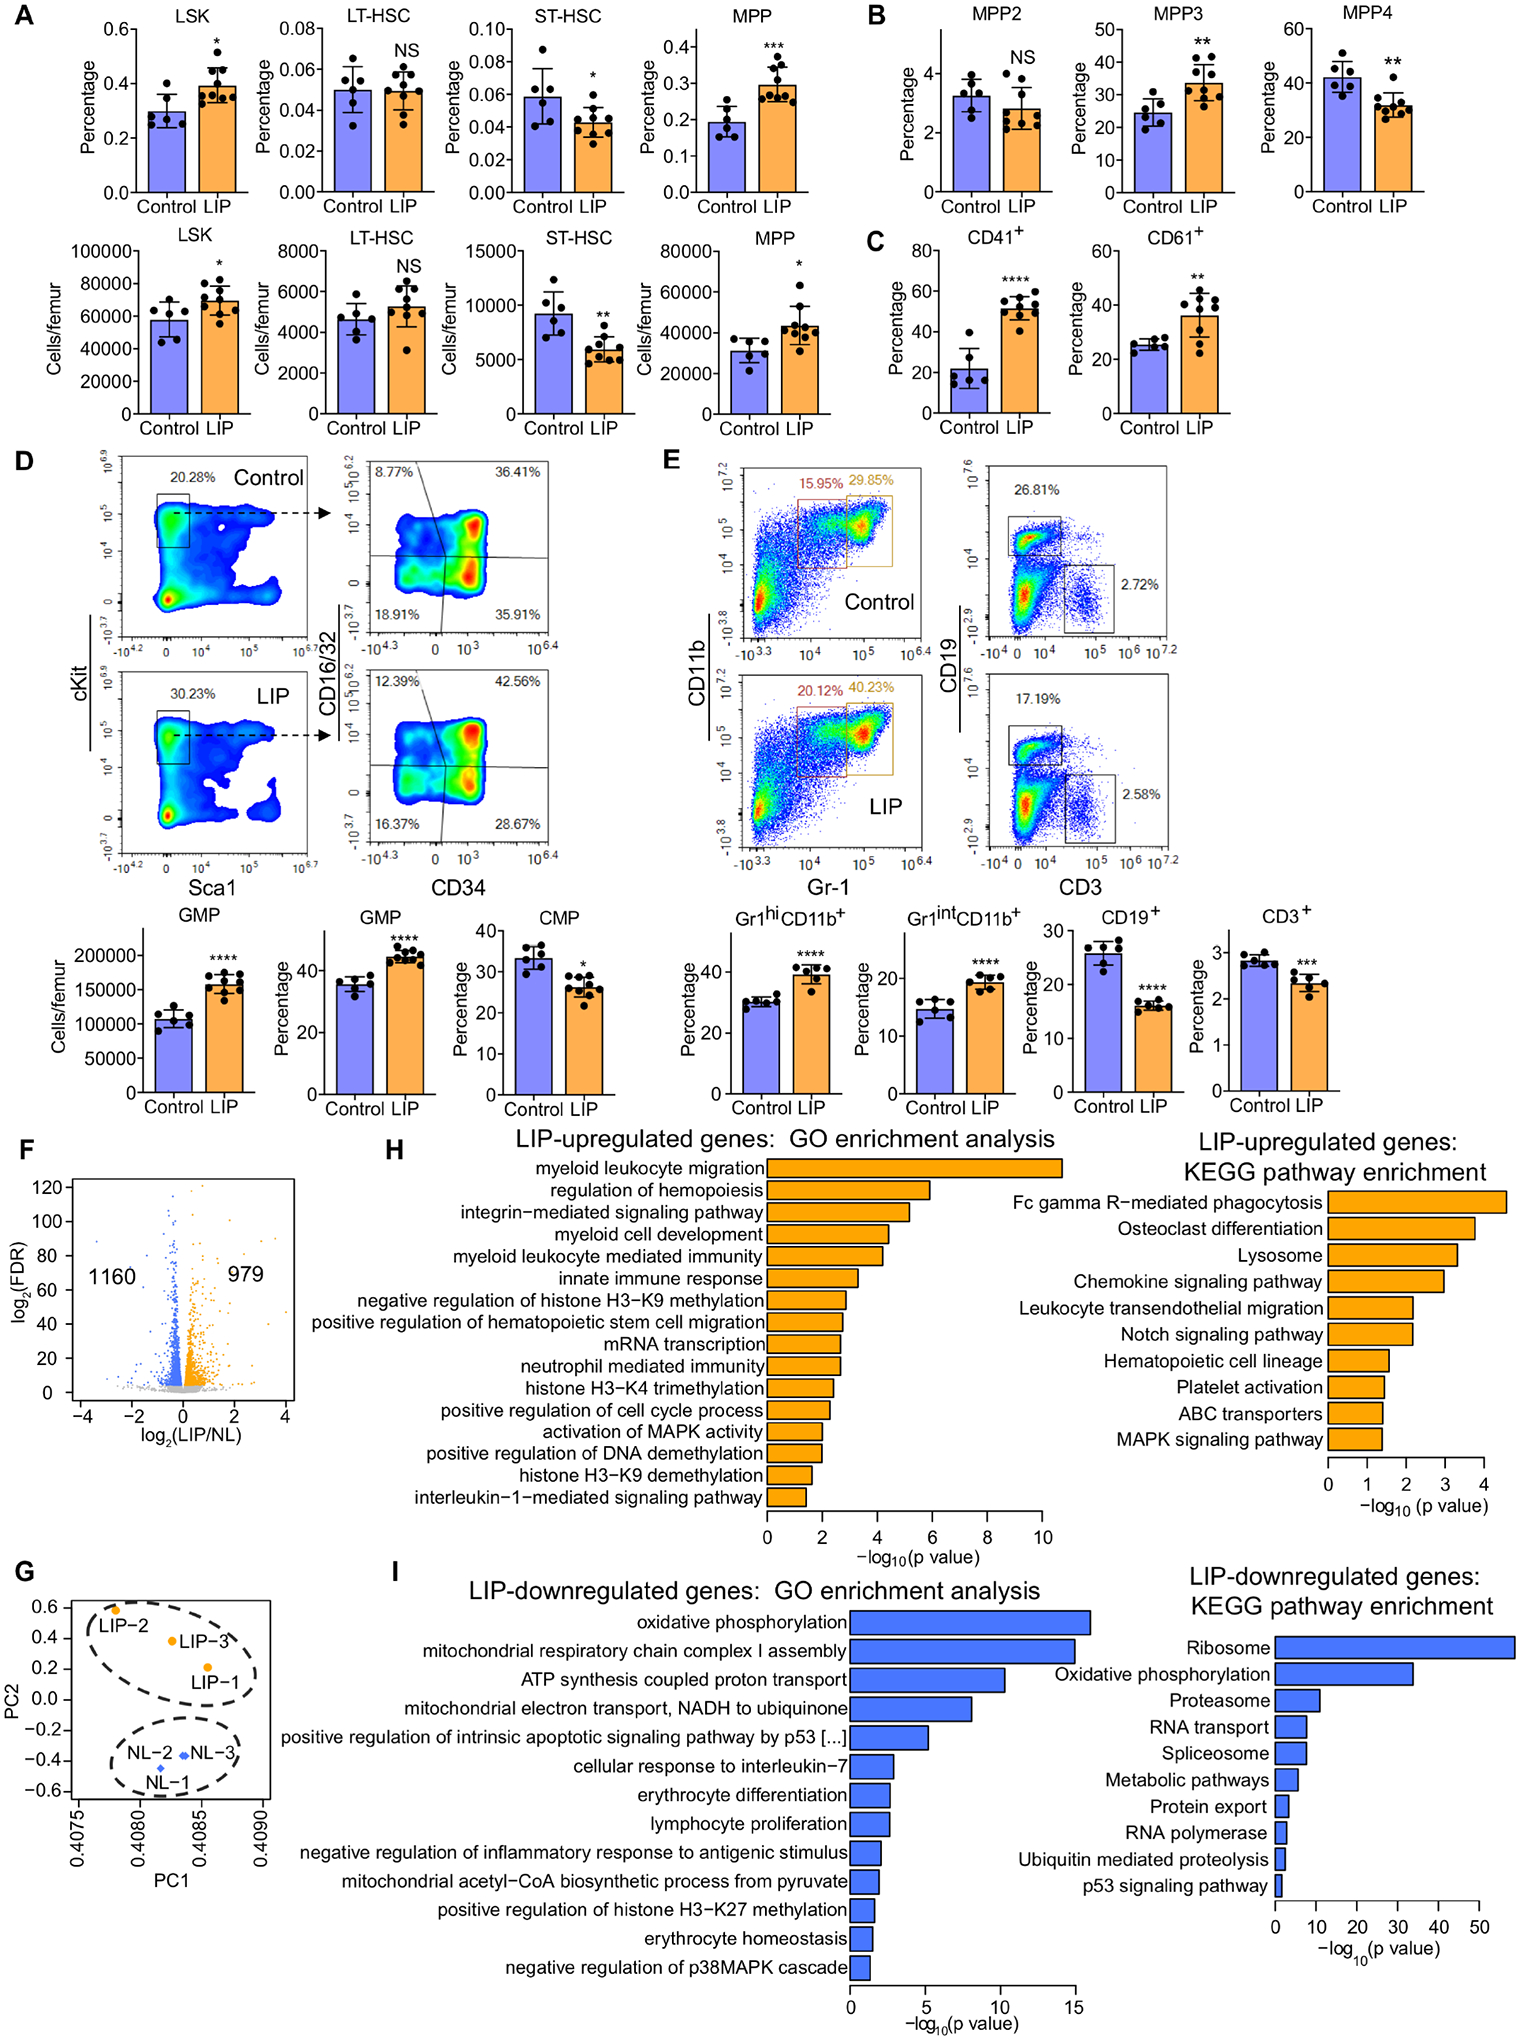
Figure 1. LIP causes a sustained increase in myelopoiesis.

Mice were subjected, or not (control), to LIP followed by BM analysis after 21 days. (A) Frequencies (top) of LSK, LT-HSC, ST-HSC and MPP in total BM cells and absolute cell numbers (bottom) of the same populations. (B) Frequencies of MPP subsets in LSK in the BM of mice. (C) Frequency of CD41+ and CD61+ LT-HSC in total LT-HSC cells in the BM. (D, top) Representative FACS plots for GMP and CMP in the BM; (D, bottom) absolute cell numbers of GMP (left) and frequency within the MyP pool of GMP (middle) and CMP (right) in the BM. (E, top) Representative FACS plots to identify Gr1hiCD11b+ granulocytes, Gr1intCD11b+ myeloid cells, CD19+ B cells and CD3+ T cells and (E, bottom) frequencies of these populations in CD45+ cells in the BM. (F-I) Mice were subjected, or not (control), to LIP and BM cells were harvested on day 7. FACS-sorted LSK were subjected to RNA-sequencing analysis. (F) Differential gene expression in LSK from LIP-subjected mice vs. non-ligated controls. Volcano plot showing the distribution of the adjusted P values (−log2(FDR)) and the fold changes (log2 fold change). Significant changes are shown in blue (down-regulated) or orange (up-regulated) (FDR<0.05), n=3. (G) PCA plot of LSK samples from ligated and non-ligated (NL) groups. Top overrepresented GO terms and KEGG pathways including upregulated (orange) (H) or downregulated (blue) genes (I) in LSK from LIP-subjected mice vs. NL controls. (A-D) Control, n=6 mice/group; LIP, n=9 mice/group and (E) n=6 mice/group. Data are means±SD. *P<0.05, **P<0.01, ***P<0.001, ****P<0.0001, NS, not significant vs. control mice; two-tailed Student’s t-test. See Figure S1.
