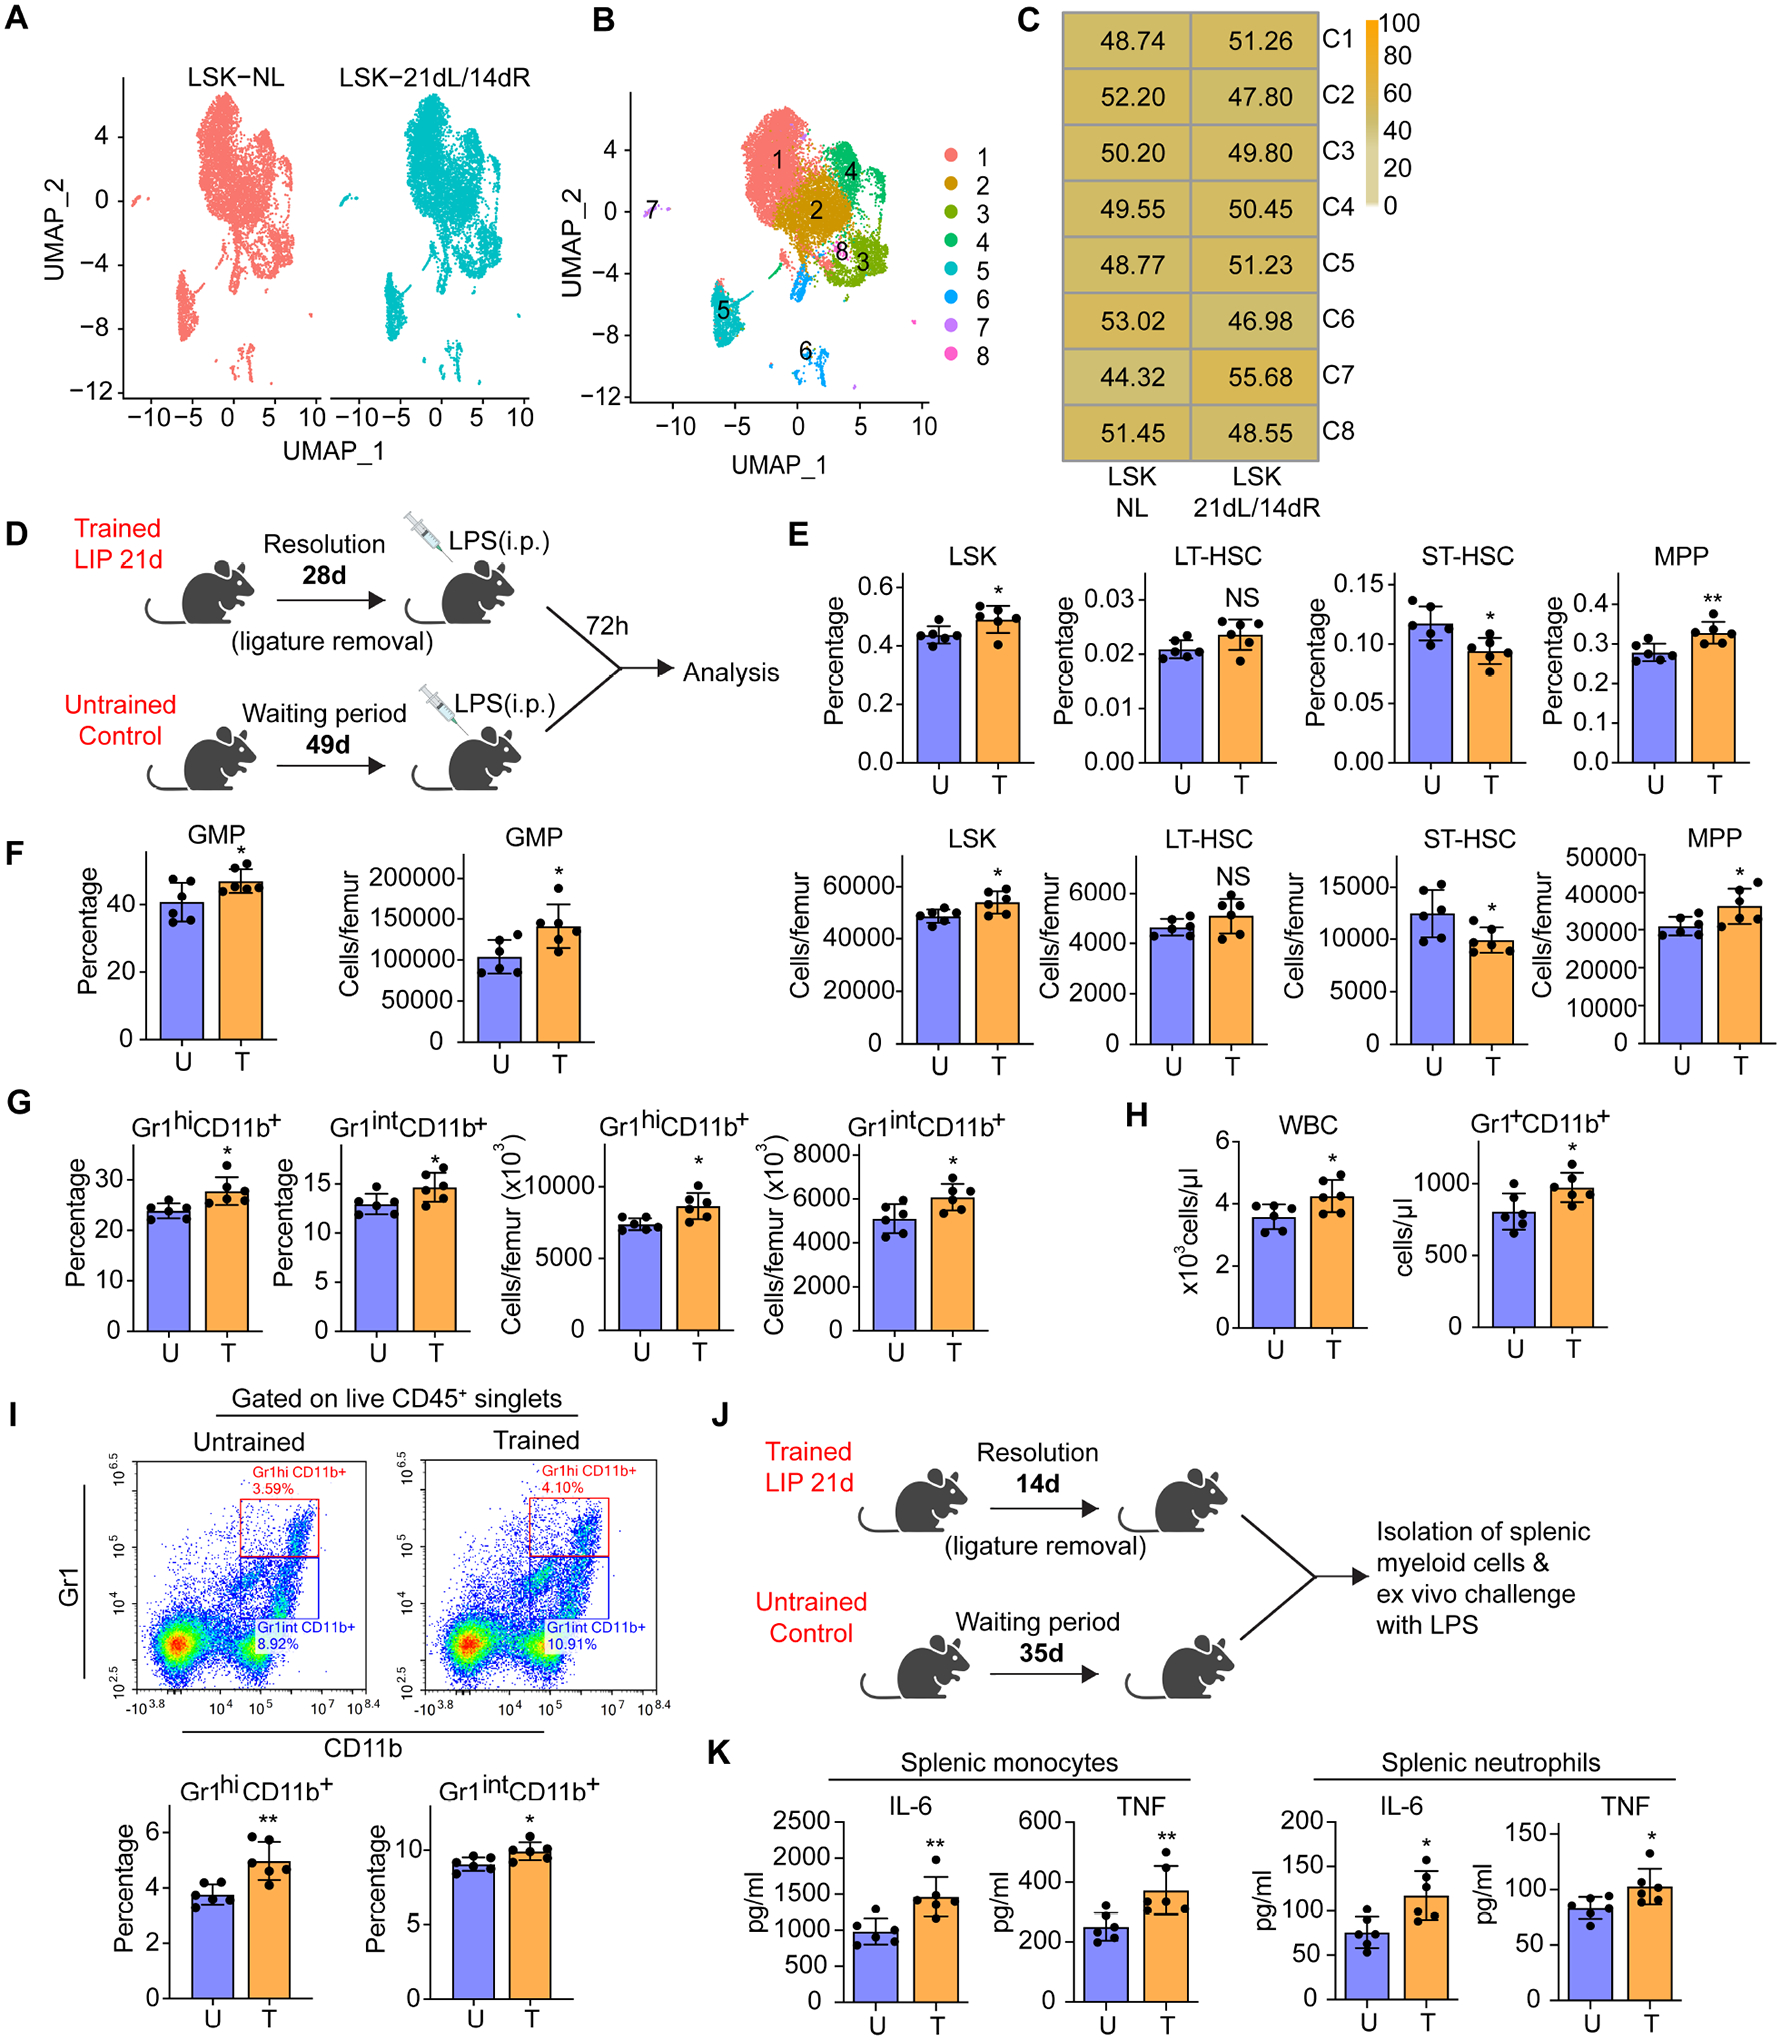
Figure 2. LIP-experienced mice display increased myelopoiesis after LPS challenge.

(A-C) BM LSK were sorted from mice subjected to 21dL/14dR or not (NL) and scRNA-seq was performed. (A,B) Two-dimensional UMAP representation of 15257 cells, according to (A) sample origin and (B) results of clustering. (C) Heat map visualization of the distribution of cells within each of the identified clusters, normalized for the number of cells per sample in the dataset. (D) Experimental design. (E) Frequencies (top) of LSK, LT-HSC, ST-HSC and MPP in total BM cells and absolute cell numbers (bottom) of the same populations. (F) Frequency (left) within the MyP pool of GMP and absolute numbers (right) of GMP in the BM. (G) Frequency of Gr1hiCD11b+ granulocytes and Gr1intCD11b+ myeloid cells in CD45+ cells (left) and cell numbers (right) of the same populations in the BM. (H) Total white blood cell (WBC) count (left) and Gr1+CD11b+ cell counts (right) in the peripheral blood. (I) Representative FACS plots (left) to identify Gr1hiCD11b+ granulocytes and Gr1intCD11b+ myeloid cells and frequency (right) of the same populations in CD45+ cells in the lungs of mice. (J) Experimental design. (K) Isolated splenic monocytes and neutrophils were re-stimulated ex vivo with LPS (10ng/ml) for 24h. The supernatant was collected for measuring IL-6 and TNF. Data are means±SD (n=6 mice/group) (E-I and K). *P<0.05, **P<0.01, NS, not significant vs. untrained mice; two-tailed Student’s t-test. U, untrained; T, trained. See Figure S2.
