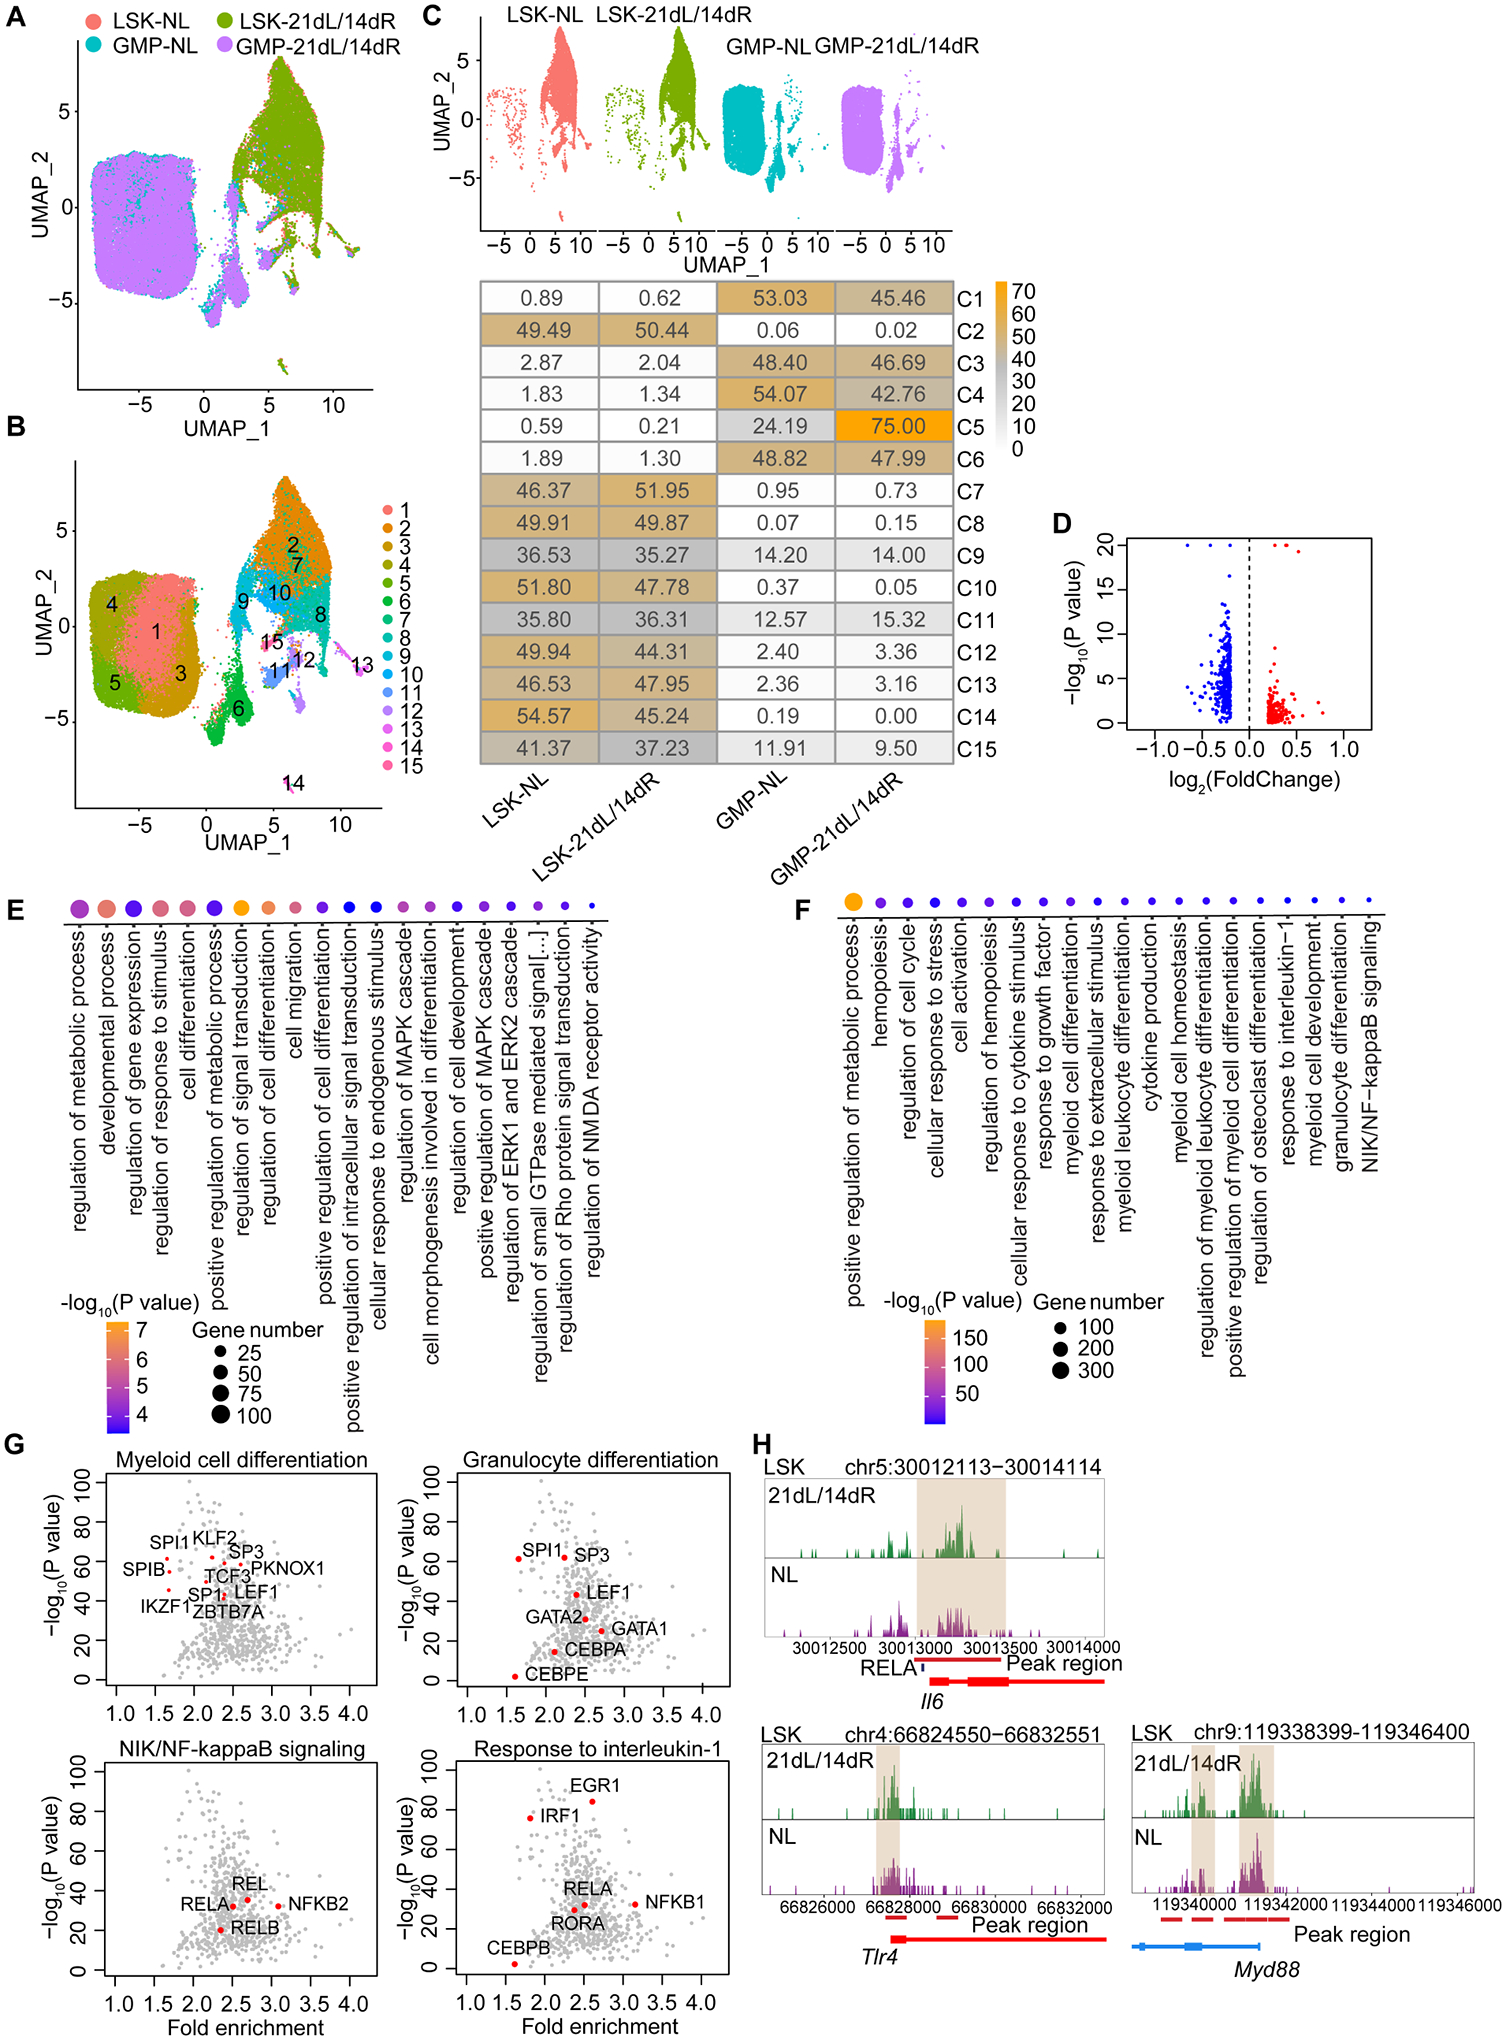
Figure 3. Epigenetic rewiring of trained LSK and GMP.

BM LSK and GMP were sorted from mice subjected to 21dL/14dR or not (NL) and scATAC-seq was performed. (A, B) Two-dimensional UMAP representation of 37,903 cells, according to (A) sample origin and (B) results of clustering. (C) UMAP (up) of the distribution of cells from the four different samples (LSK and GMP subjected to 21dL/14dR or not) and heat map visualization (bottom) within each of the identified clusters, normalized for the number of cells per sample in the dataset are shown. (D) Volcano plots displaying differential accessibility analysis results (blue, lower vs. red, greater differential chromatin accessibility) for LSK subjected to 21dL/14dR vs. their counterparts from control mice (abs(Log2FC) ≥ 0.2, P<0.05). (E) GO enrichment results of top 20 significantly enriched GO terms sorted by PANTHER based on genes annotated to regions more accessible due to 21dL/14dR treatment (Bonferroni-corrected, P<0.05). (F) GO enrichment analysis of enriched TF binding motifs in LSK subjected to 21dL/14dR vs. control (NL) group and the top 20 significantly enriched GO terms (Bonferroni-corrected, P<0.05). (G) Visualization of top enriched TF binding motifs in the indicated GO terms for the LIP specifically accessible regions in LSK using the homer TF motif database. (H) Genome browser track showing DAR in the Il6 gene locus and the RELA binding motifs within this region, as well as DARs close to the promoter regions of Tlr4 and Myd88 gene locus. See Figure S3.
