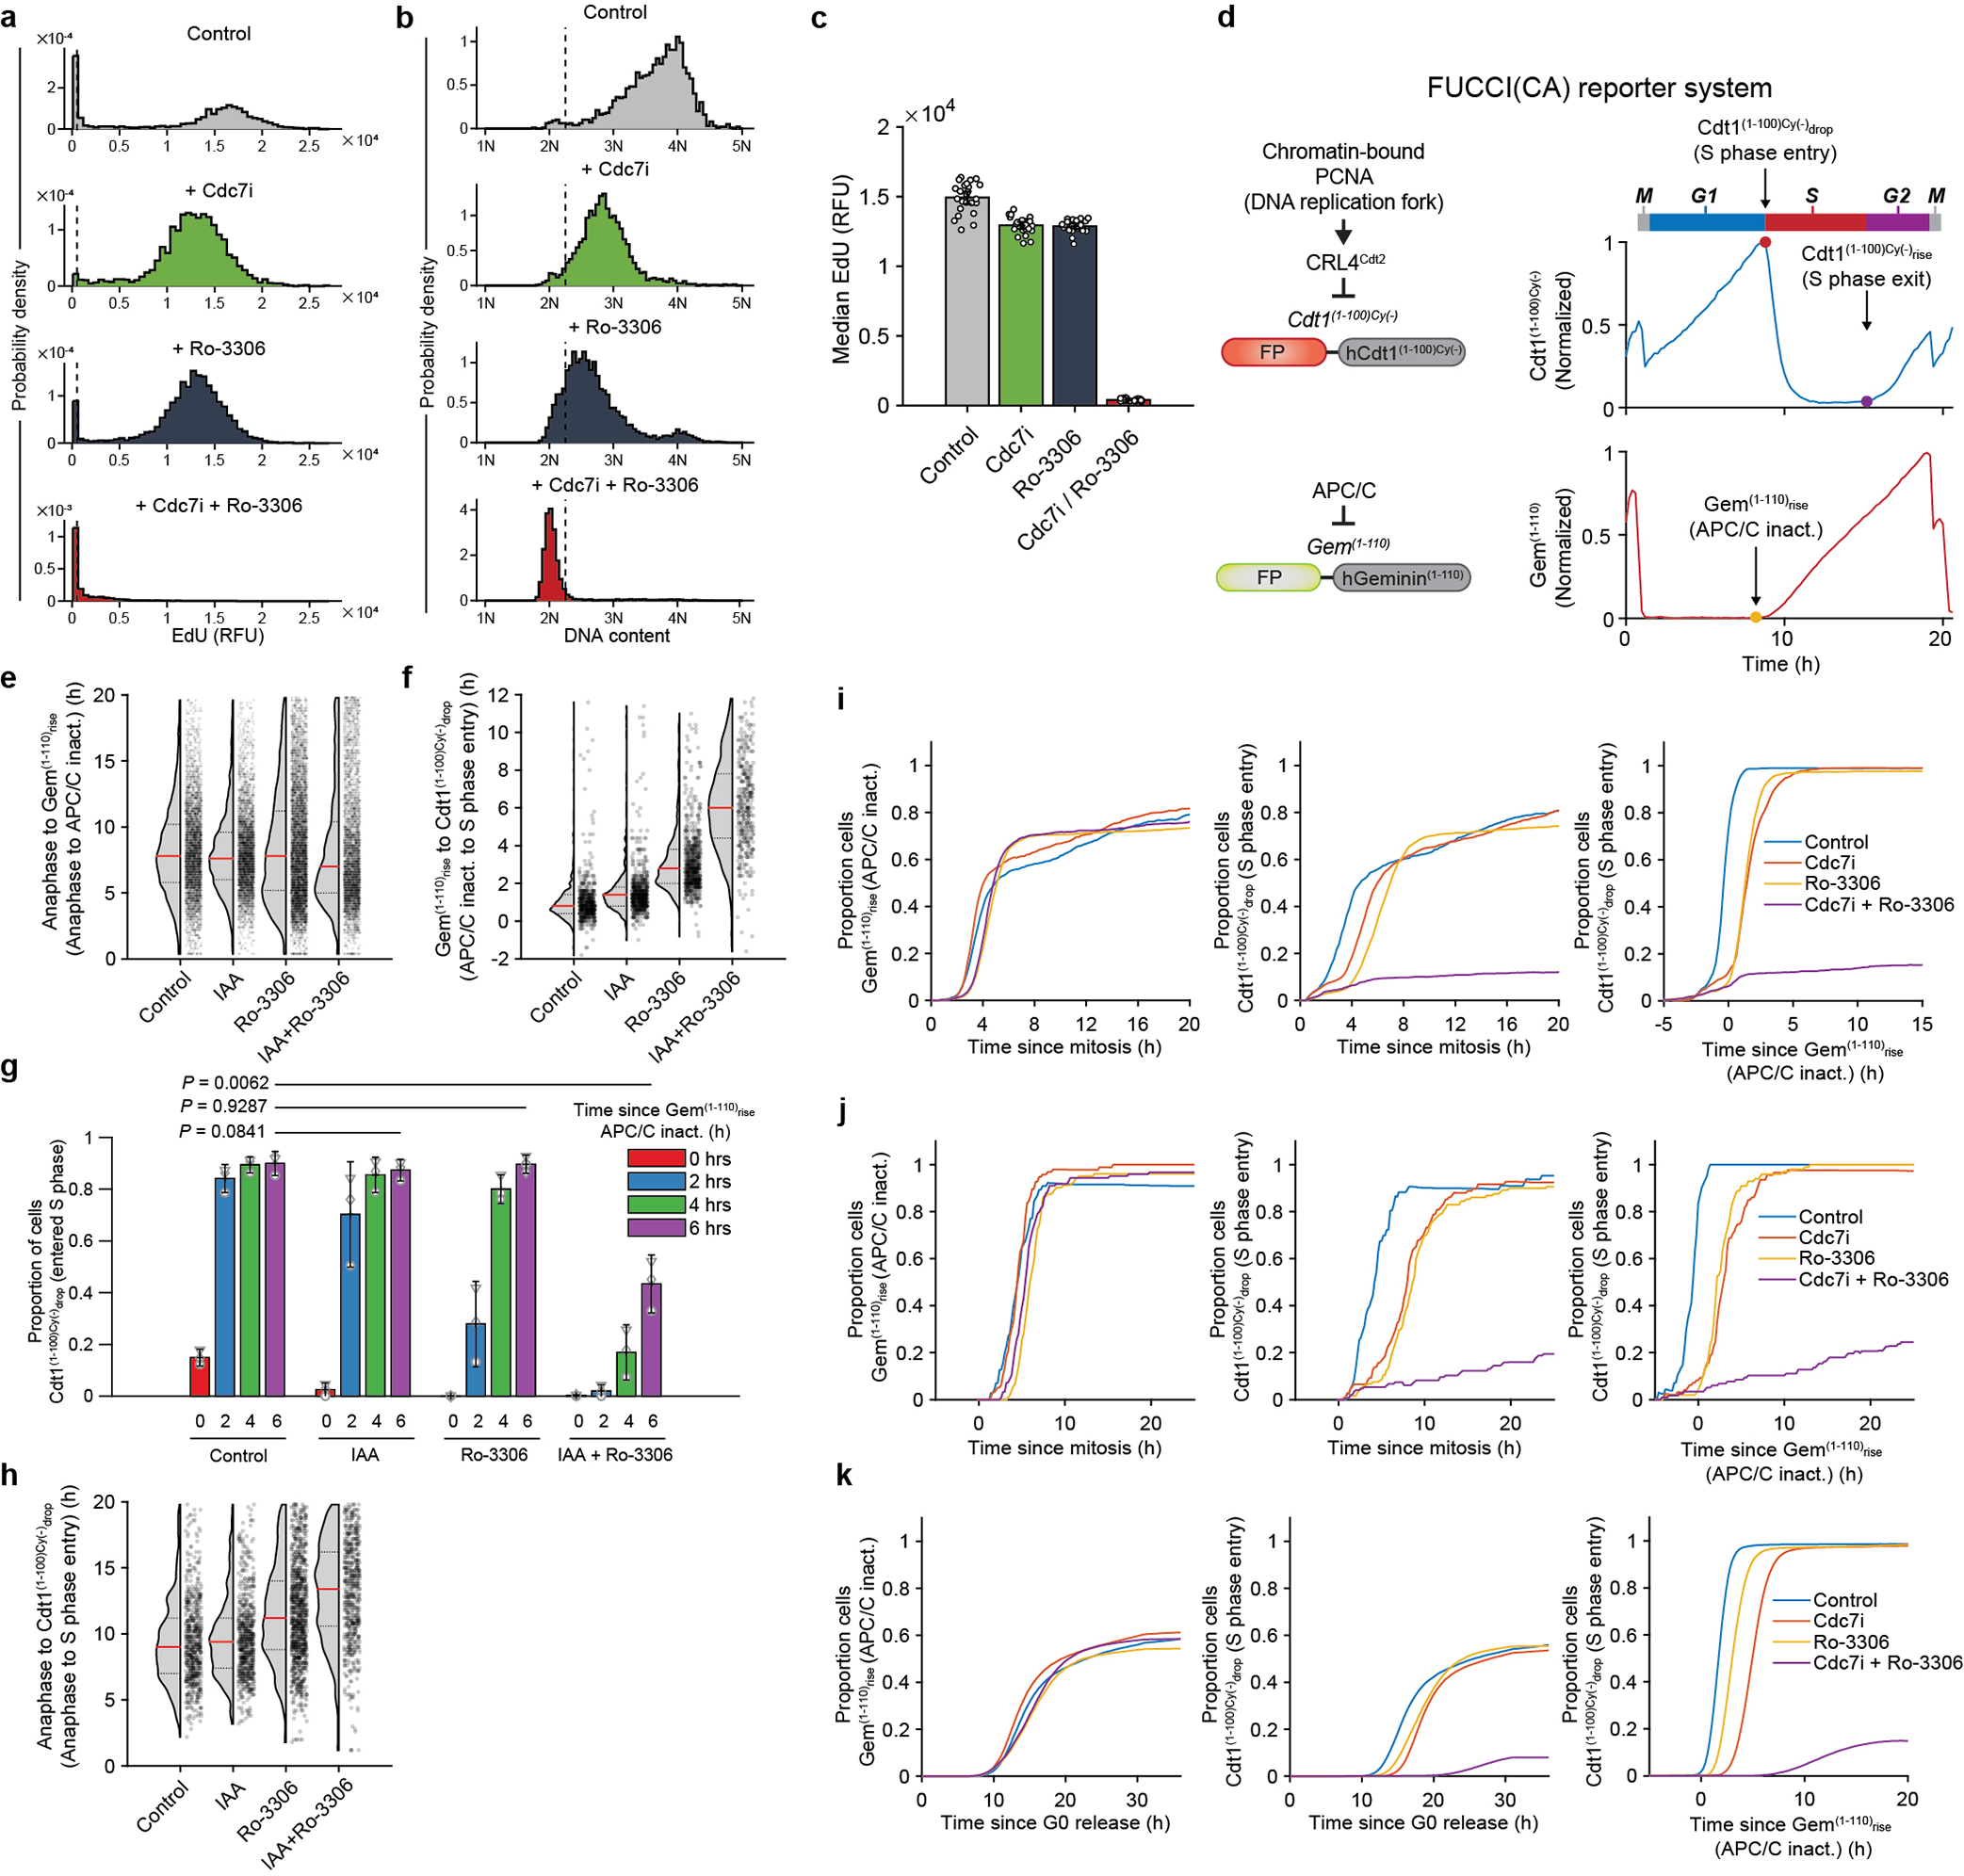
Extended Data Fig. 9. Live-cell imaging.

a-c, Primary human dermal fibroblasts were live-imaged and treated with vehicle (Control), CDC7 inhibitor TAK-931 (Cdc7i), CDK1 inhibitor Ro-3306, or with both inhibitors. Cells which received the inhibitor(s) starting 0–2 h after the exit of mitosis were selected for analysis. Cells were pulsed with EdU and analyzed for EdU incorporation intensity (a), and DNA content from Hoechst staining (b) 12–14 h after mitosis. Dashed vertical lines in a represent cutoff values for EdU-positive signal, in b for signal corresponding to >2N DNA significantly above 2N noise. c, Median EdU incorporation (from a). Each circle corresponds to a replicate well. d, FUCCI(CA) cell cycle reporter system used in the study. The system consists of fluorescent protein (FP)-tagged fragments of human Cdt1 (Cdt1(1–100)Cy(−)) and human Geminin (Gem(1–110)). Cdt1(1–100)Cy(−) is present during G1, and is rapidly degraded in response to origin firing at the start of S phase (Cdt1(1–100)Cy(−)drop). After the S phase ends, the reporter reaccumulates (Cdt1(1–100)Cy(−)rise). Gem(1–110) is degraded by the anaphase-promoting complex/cyclosome (APC/C) starting at anaphase and throughout G1 phase, until APC/C inactivation takes place at the end of G1 (Gem(1–110)rise). e-h, Asynchronously growing Cdc7AID/AID/Tir1 MEFs expressing FUCCI(CA) reporters were live-imaged in the presence of auxin or vehicle for 4 h and then Ro-3306 was added to cells. Cells which received Ro-3306 0–2 h after the exit from mitosis were selected for analysis. e, Time from the end of mitosis to Gem(1–110)rise (APC/C inactivation), in cells treated as indicated. Shown are cells with Gem(1–110)rise by 20 h after mitosis. f, g, Timing of Cdt1(1–100)Cy(−)drop (S phase entry) relative to Gem(1–110)rise (APC/C inactivation), in cells treated as above. f, Values for cells with Cdt1(1–100)Cy(−)drop within 12 h of Gem(1–110)rise. g, Fraction of cells which had Cdt1(1–100)Cy(−)drop (S phase start) at given times following Gem(1–110)rise (APC/C inactivation). h, Time from the end of mitosis to Cdt1(1–100)Cy(−)drop (S phase entry), in cells treated as indicated. In e, f, h, dots represent values for individual cells, pooled from independent experiments. Red horizontal lines, median values; dotted lines above and below the median, inter-quartile range. Control, vehicle-treated cells. i, j, Analysis of human mammary epithelial MCF10A (i) and osteosarcoma U2OS cells (j) expressing FUCCI(CA) system. Cells were live-imaged and treated with TAK-931 (CDC7i) and/or Ro-3306, or with vehicle (Control). Cells which were treated 0–2 h after the exit from mitosis were selected for analysis. Left panel: proportion of cells which underwent Gem(1–110)rise (APC/C inactivation) over time following the end of mitosis; middle: proportion of cells which underwent Cdt1(1–100)Cy(−)drop (S phase entry) over time following the end of mitosis; right: proportion of cells which underwent S phase entry (Cdt1(1–100)Cy(−)drop) over time following APC/C inactivation (Gem(1–110)rise). k, Analyses of MCF10A cells engineered as in i. Cells were arrested in G0, then induced to re-enter the cell cycle by re-addition of growth factors in the presence of TAK-931 and/or Ro-3306, or with vehicle, and analyzed as in i. c, g, Show mean values; error bars 2×SEM; p-values using two-sided t-test. e-h, n=3 independent replicates.
