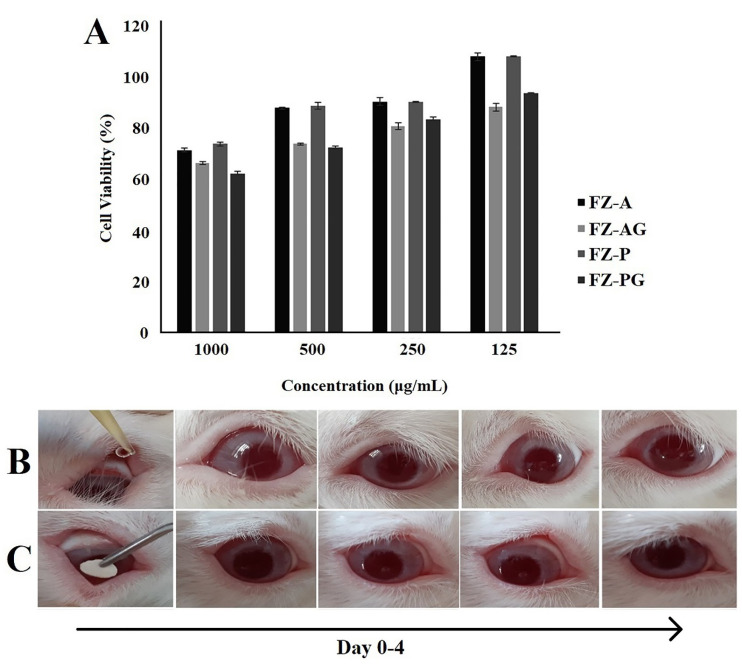
Figure 5.
Cell viability measured by MTT assay (A) after treatment with different concentrations of nanofibrous formulations. Data are expressed as the mean ± SD of three separate experiments (n = 6). The appearance of rabbit eyes treated with 50 μL of PBS (B) and PBS + FZ-A nanofiber (C) through the irritation test using topical delivery acquired on day 0 to 4.

