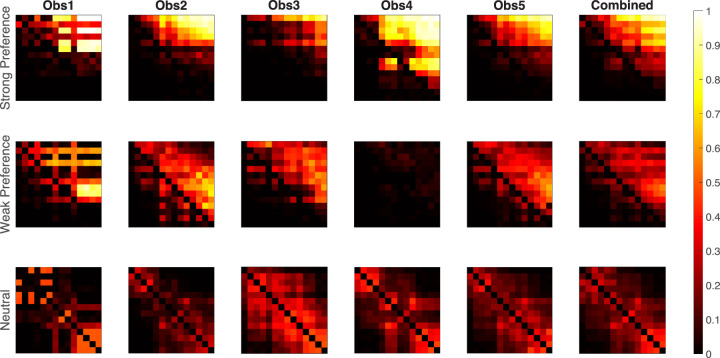
Figure A1.
Matrices showing the frequency that one stimulus is strongly or weakly preferred over another or that the two stimuli are judged equal in value, for each observer and the Combined observer, used in constructing the Thurstone scale. The color of the pixel represents the rate of preference for the row condition over the column condition. The sequence of the conditions is the same as the transparency scale order.

