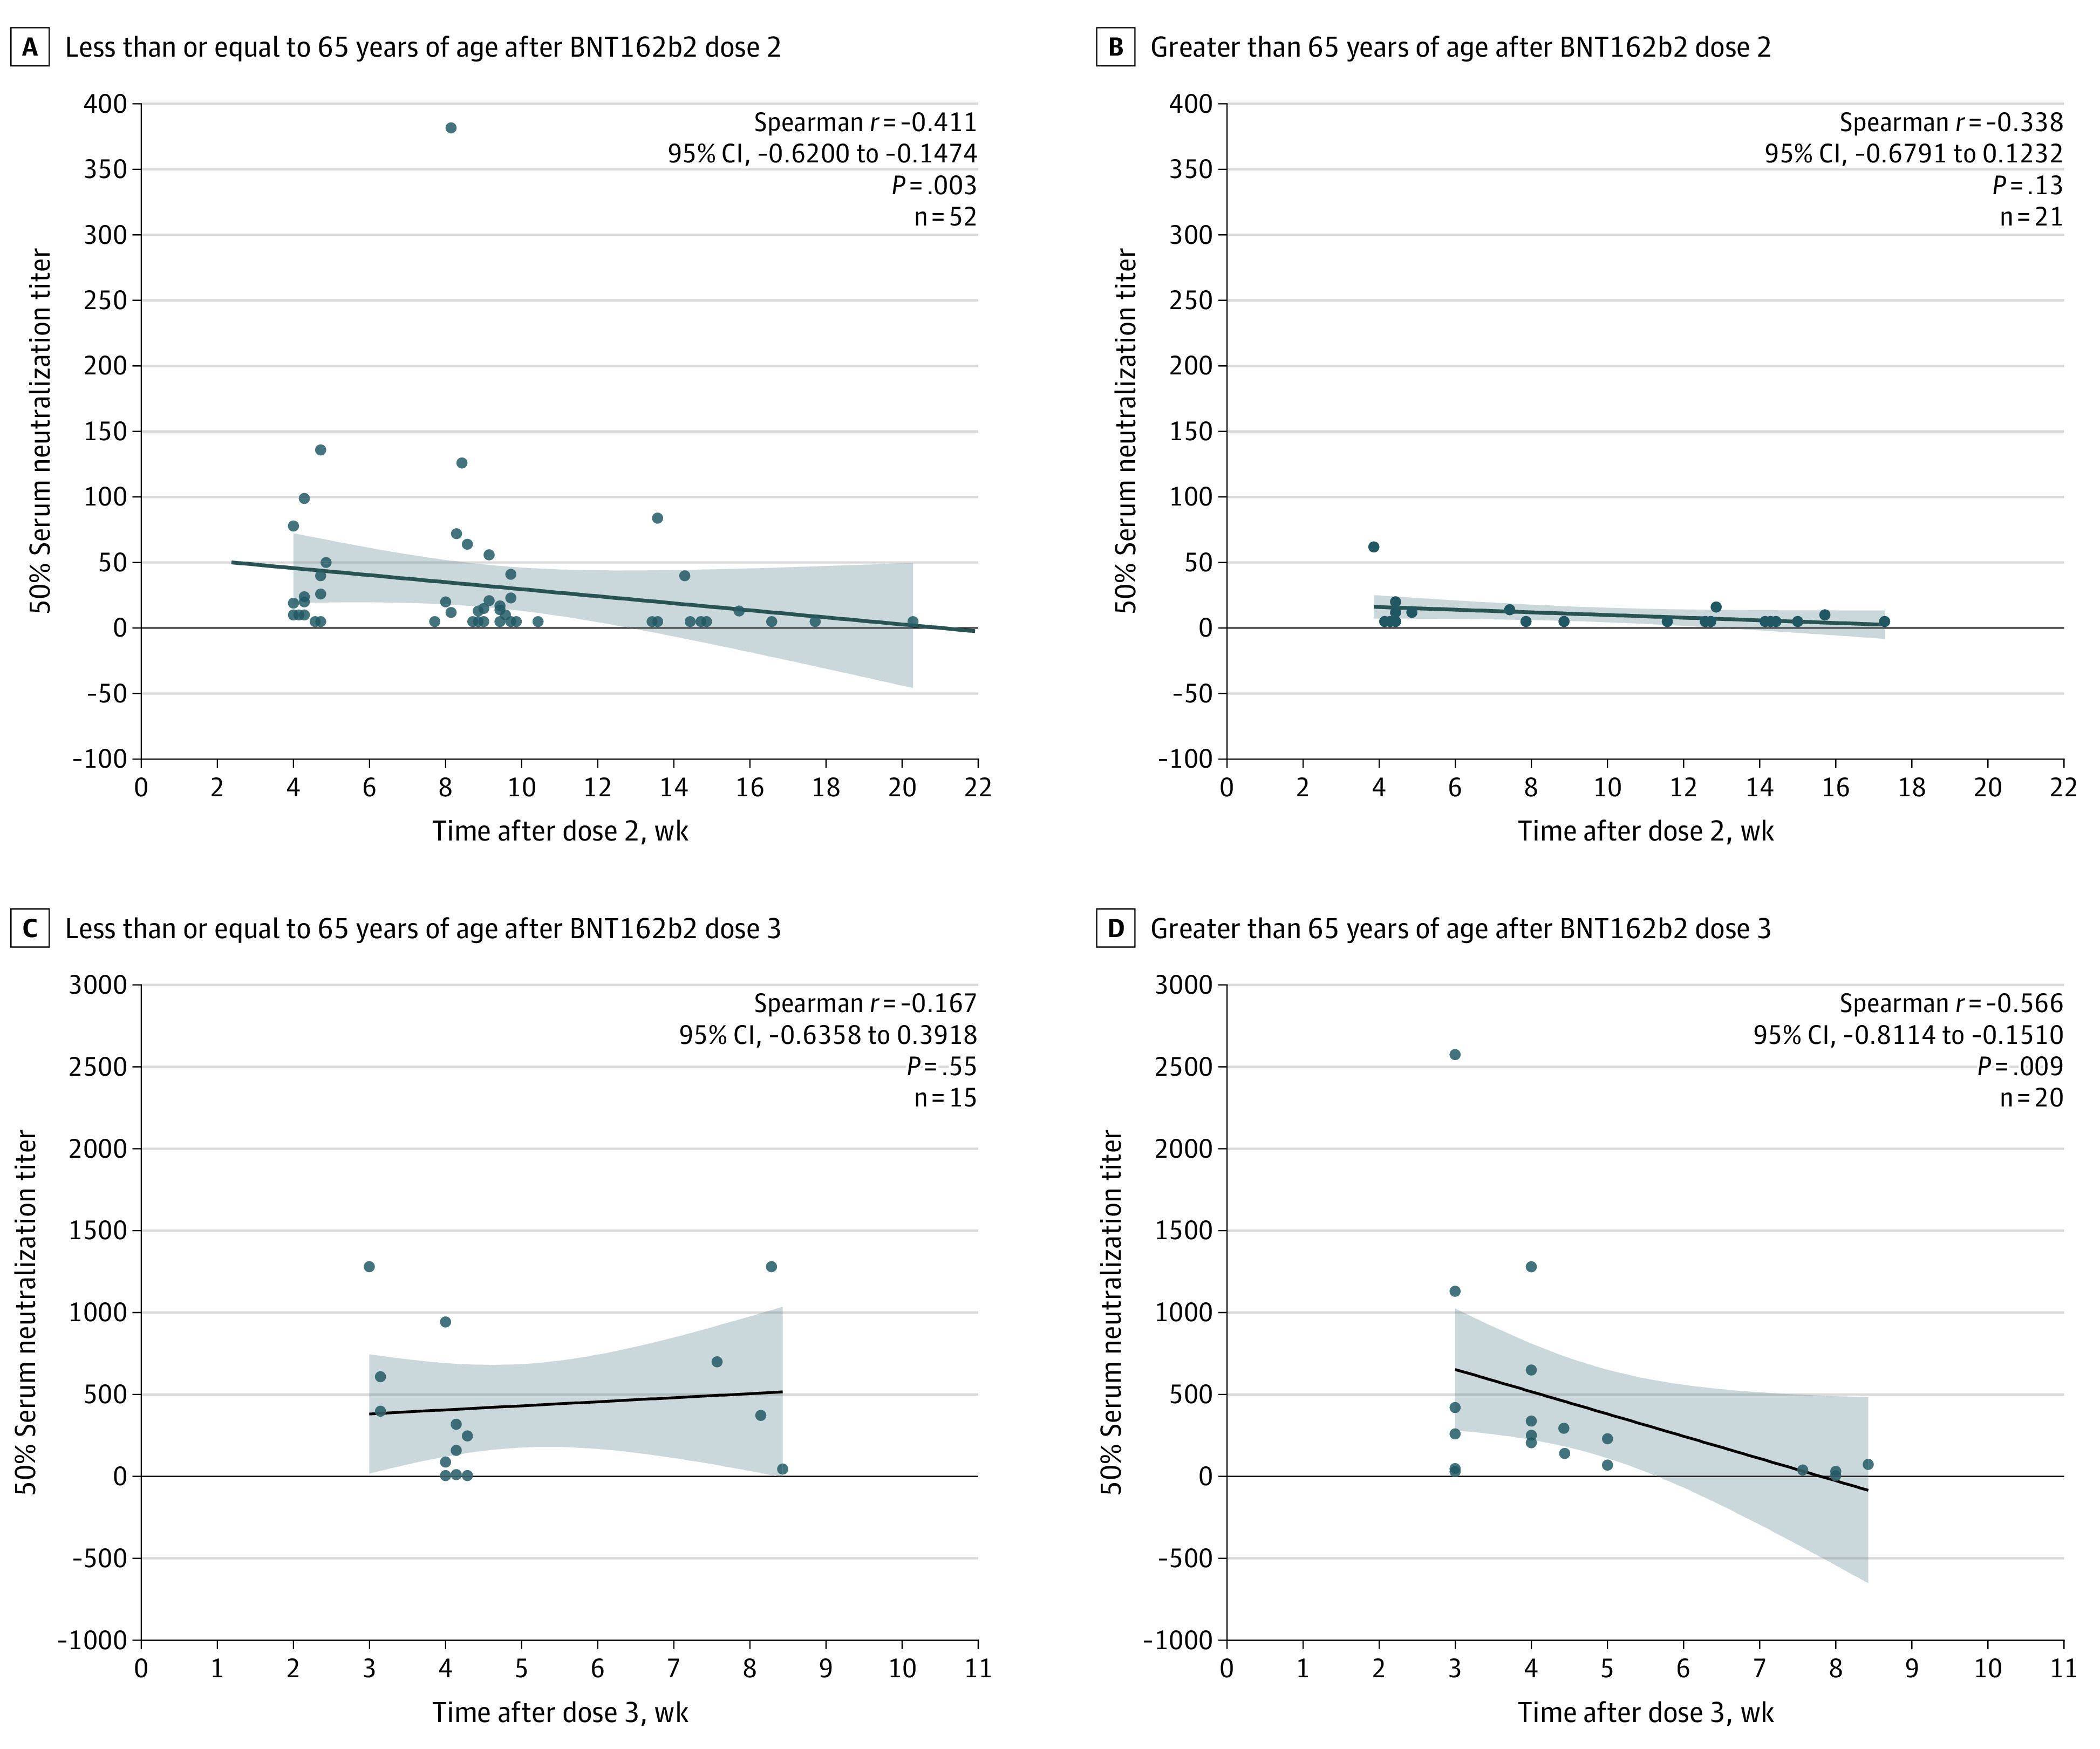
Figure 2. Temporal Omicron Virus Neutralization Titers Following 2 or 3 BNT162b2 Doses in Different Age Groups.

Individuals who received the primary 2-dose BNT162b2 vaccination series (n = 73; sampling between peak responses at 4 weeks and the last time point, 16 weeks, after dose 2) or 3 BNT162b2 doses (n = 35; sampling between peak responses at 3 weeks and the last time point, 8 weeks) were categorized according to 2 different age groups: less than or equal to 65 years of age and greater than 65 years of age. Omicron-specific neutralization titers for each age group were stratified according to time after vaccine dose. The dot plots represent 50% serum neutralization titers relative to day of sample collection after the second or third BNT162b2 dose for each age group. Each data point presents an individual sample; the black lines represent the linear regression curve and the shaded areas the 95% CI. The association between the 2 continuous variables were assessed using the Spearman correlation test.
