
Extended Data Fig. 7 |. Proportion of “resident-like” and inflammatory macrophages and their respective molecular signature.
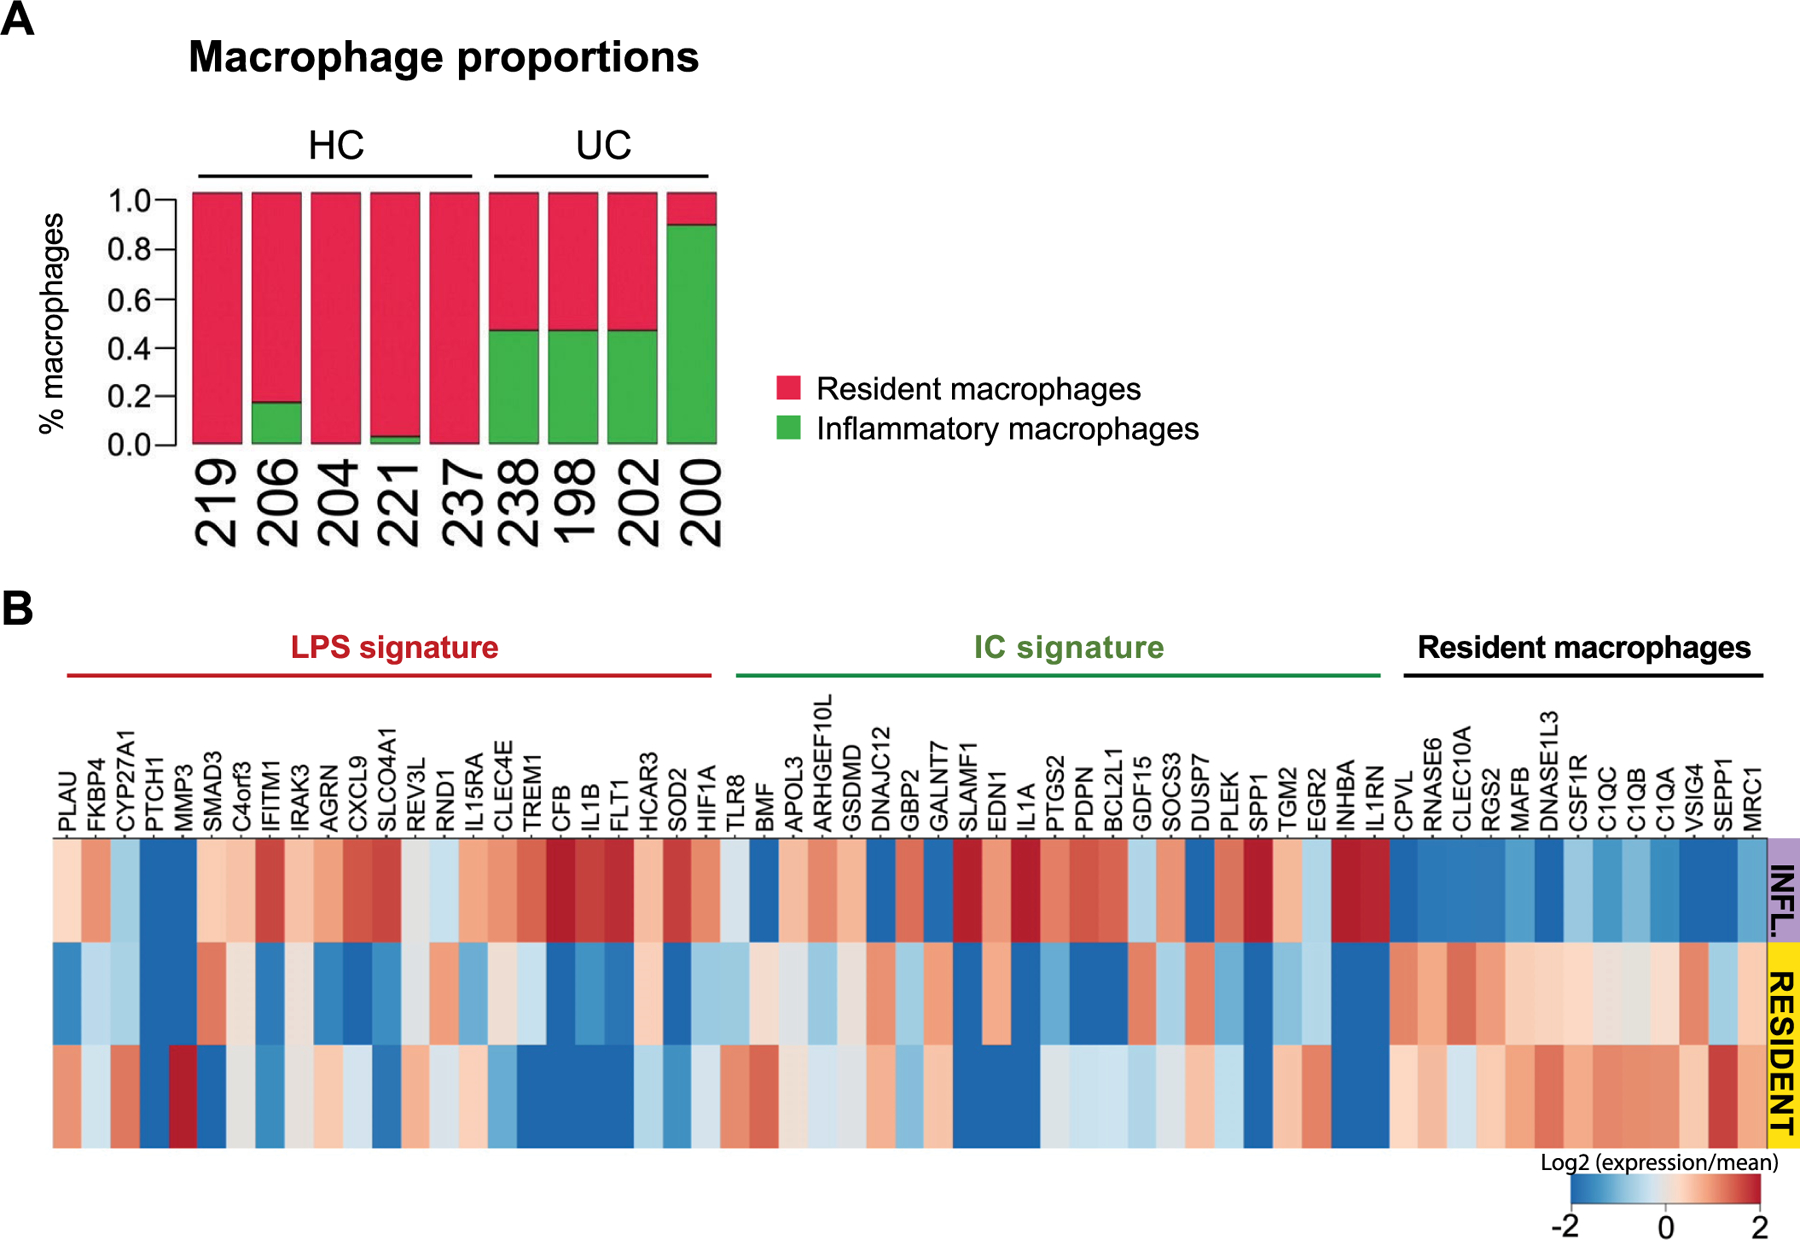
a, Proportion of “resident-like” macrophages and inflammatory macrophages among total colonic macrophages represented in individual samples of healthy controls UC and patients. b, Heat-map showing color-coded down-sampled UMI counts of gene programs identifying LPS signature (red), immune complexes (IC) signature (green) and resident macrophage genes signatures (black).