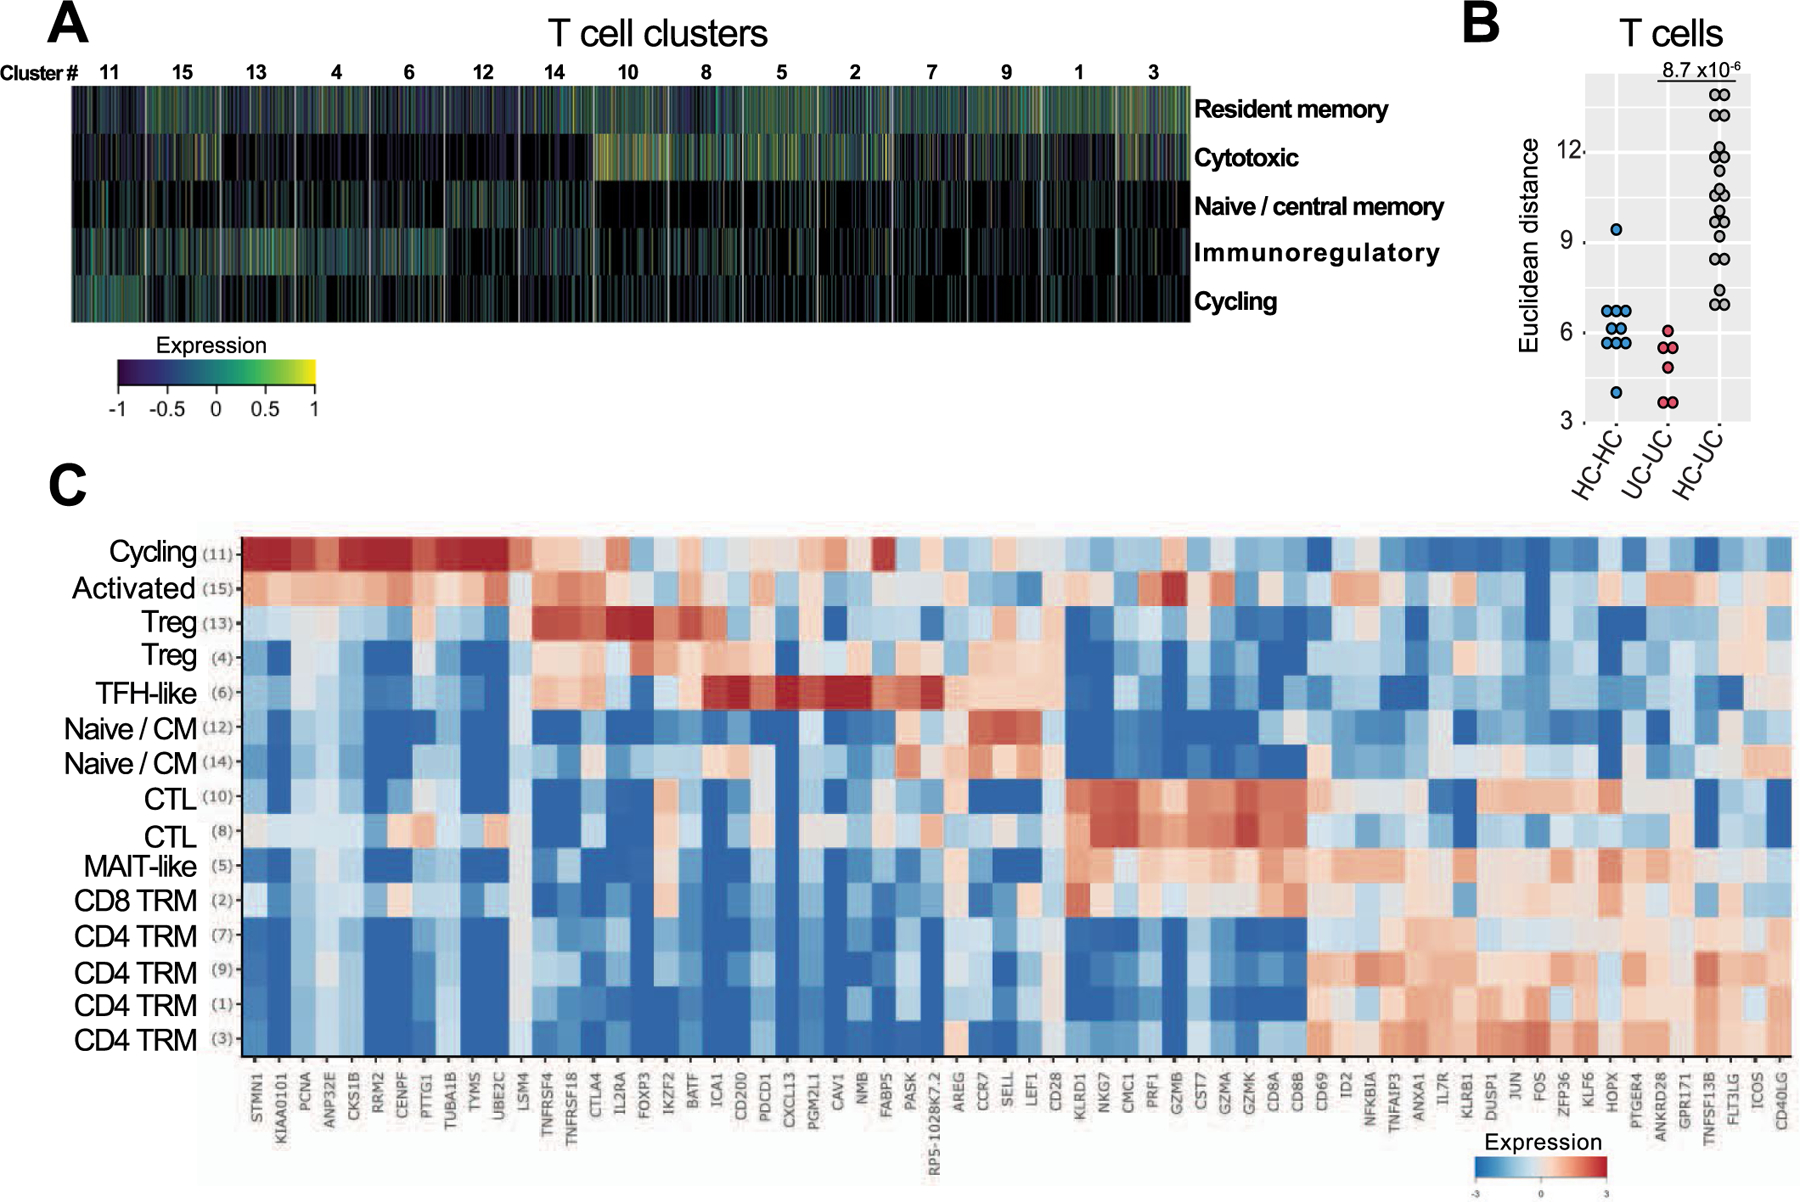
Extended Data Fig. 8 |. Characterization of T cell clusters from single-cell RNA sequencing of colonic biopsies.

a, Heat-map showing the relative expression of 5 transcriptional scores (rows) (see Methods) in single T cells (n = 11281 cells) (columns). Cell clusters are demarcated by gray bars. Detailed cell counts per T cluster per sample are accessible in Supplementary Table 2. b, Euclidean distance for lineage normalized cell type frequencies was compared within healthy controls (HC), (HC-HC, blue), patients with UC (UC-UC, red) and between HC and patients with UC (HC-UC, grey) for T cells, Wilcoxon rank-sum test. c, Relative expression of genes identifying T cell subsets. Heatmap is showing log-2 transformed expression per subset divided by the mean expression across all subsets.
