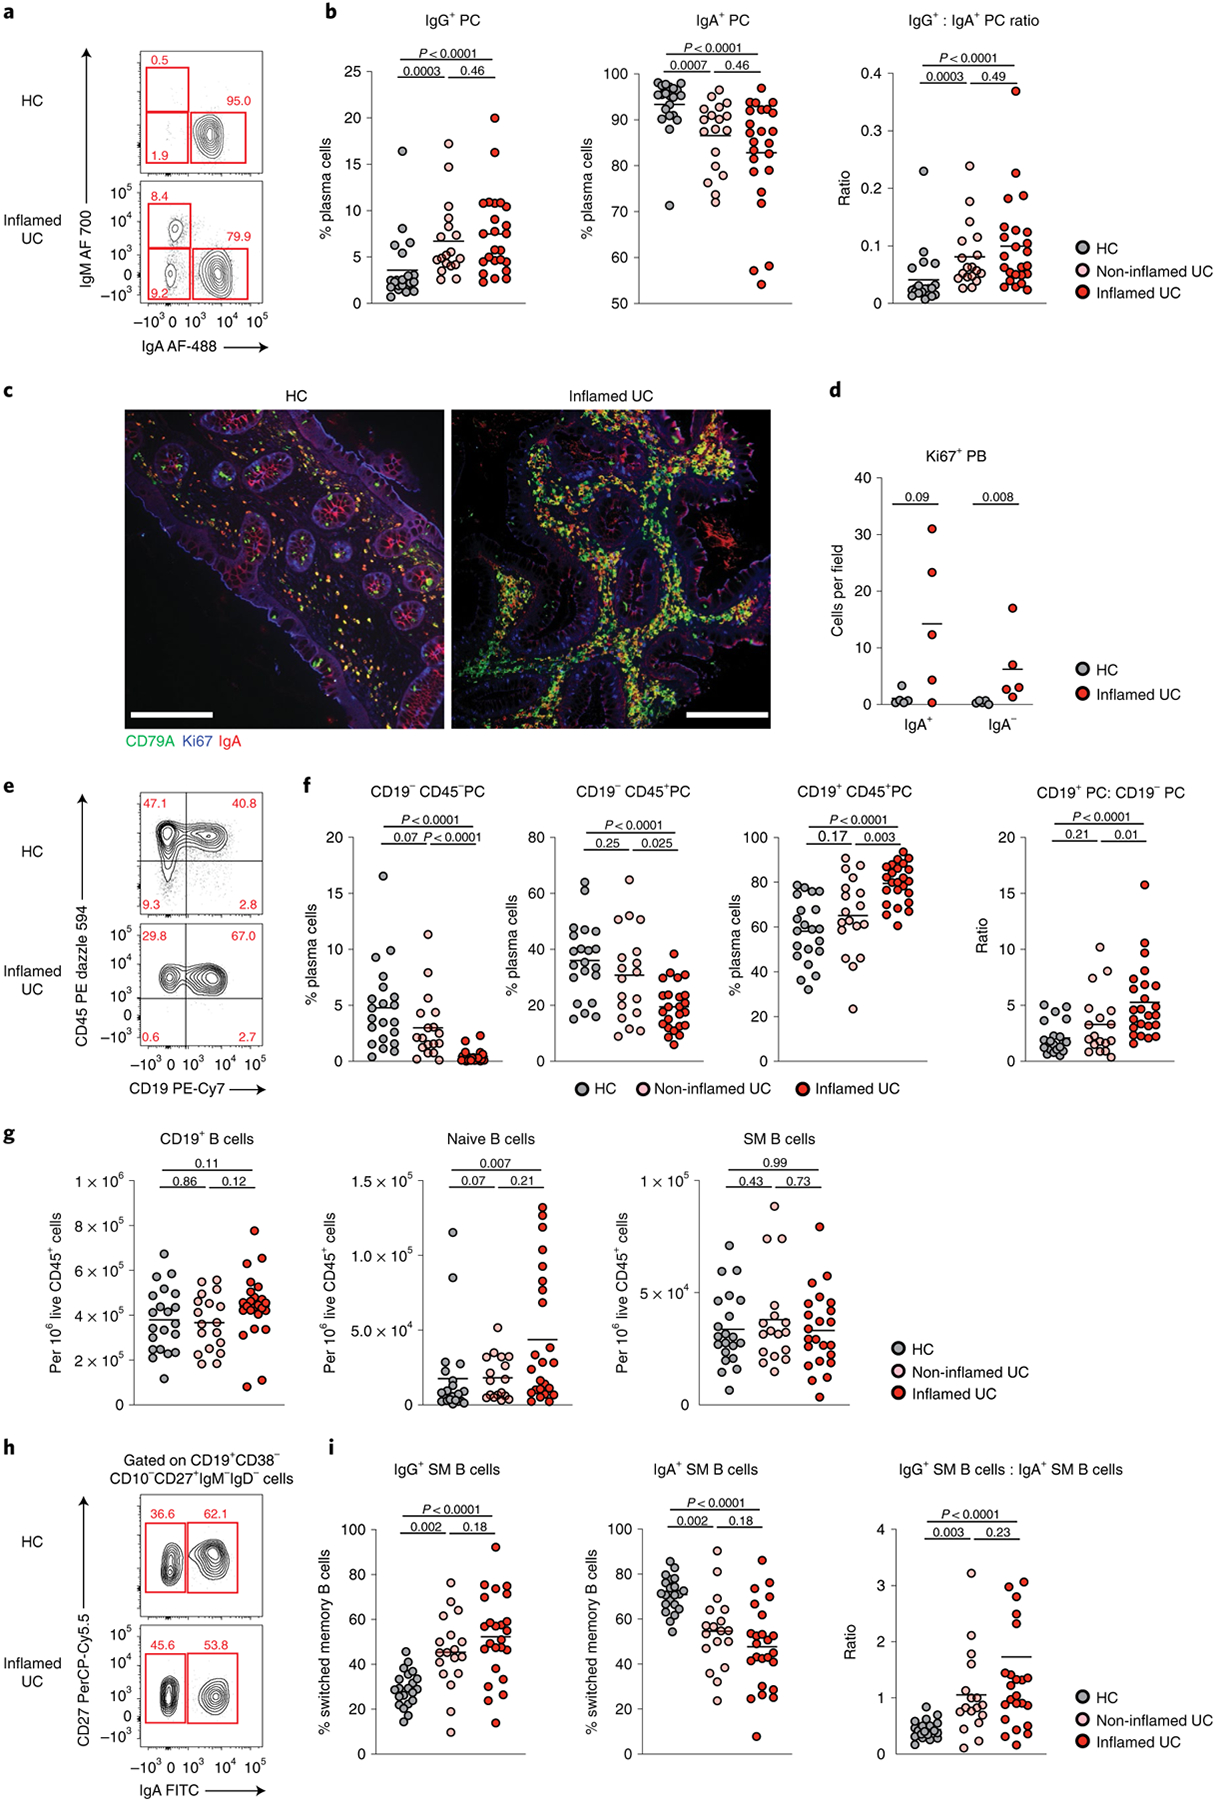
Fig. 2 |. Major disruptions of B cell populations in inflamed colon of patients with UC.

a, Representative flow plots showing the frequency of IgA and IgM expressed on CD27+CD38++ PCs in biopsies of an HC and a patient with UC with inflammation. b, Frequency of IgG (IgA−IgM−) PC, IgA PC and IgG:IgA ratio on colonic PC in HCs (n = 21) and in inflamed (n = 24) and non-inflamed (n = 18) biopsies from patients with UC. Data are shown as individual data and mean, Mann–Whitney test, two-tailed. c, Representative images of colonic biopsies from an HC (left) and a patient with UC with inflammation (right) after immunofluorescence staining with CD79a (green), Ki67 (blue) and IgA (red) (×20 magnification); scale bar, 150 μm. d, Quantification of lamina propria IgA+ (IgA, CD79a and Ki67 triple-positive cells) and IgA− PB (CD79a and Ki67 double-positive cells) in five HCs and five patients with UC with inflammation. Data are shown as individual data and mean, Mann–Whitney test, two-tailed. e, Representative flow plots showing the frequency of short-lived (CD27+CD38++CD19+CD45+), long-lived (CD27+CD38++CD19−CD45+) and ultra-long-lived (CD27+CD38++CD19−CD45−) PCs in colonic biopsies of an HC and a patient with UC with inflammation. f, Frequency of each subset among total PCs and ratio of CD19+CD45+ to CD19−CD45+ PCs in HCs (n = 21) and in inflamed (n = 24) and non-inflamed (n = 18) biopsies from patients with UC. Data are shown as individual data and mean, Mann–Whitney test, two-tailed. g, Frequency of CD19+ B cells and naive (CD45+CD19+CD38−CD10−IgD+IgM+) and SM (CD45+CD19+CD38−CD10−IgD−IgM−) B cells out of live CD45+ lamina propria mononuclear cells in HCs (n = 21) and in inflamed (n = 24) and non-inflamed (n = 18) biopsies from patients with UC. Data are shown as individual data and mean, Mann–Whitney test, two-tailed. h, Representative flow plots showing the frequency of IgA+ and IgG (IgA−) SM B cells gated on live SM B cells in biopsies of an HC and a patient with UC with inflammation. i, Frequency of IgG, IgA SM B cells and IgG:IgA ratio in SM B cells in HCs (n = 21) and in inflamed (n = 24) and non-inflamed (n = 18) biopsies from patients with UC. Data are shown as individual data and mean, Mann–Whitney test, two-tailed. P values are as indicated in the figure.
