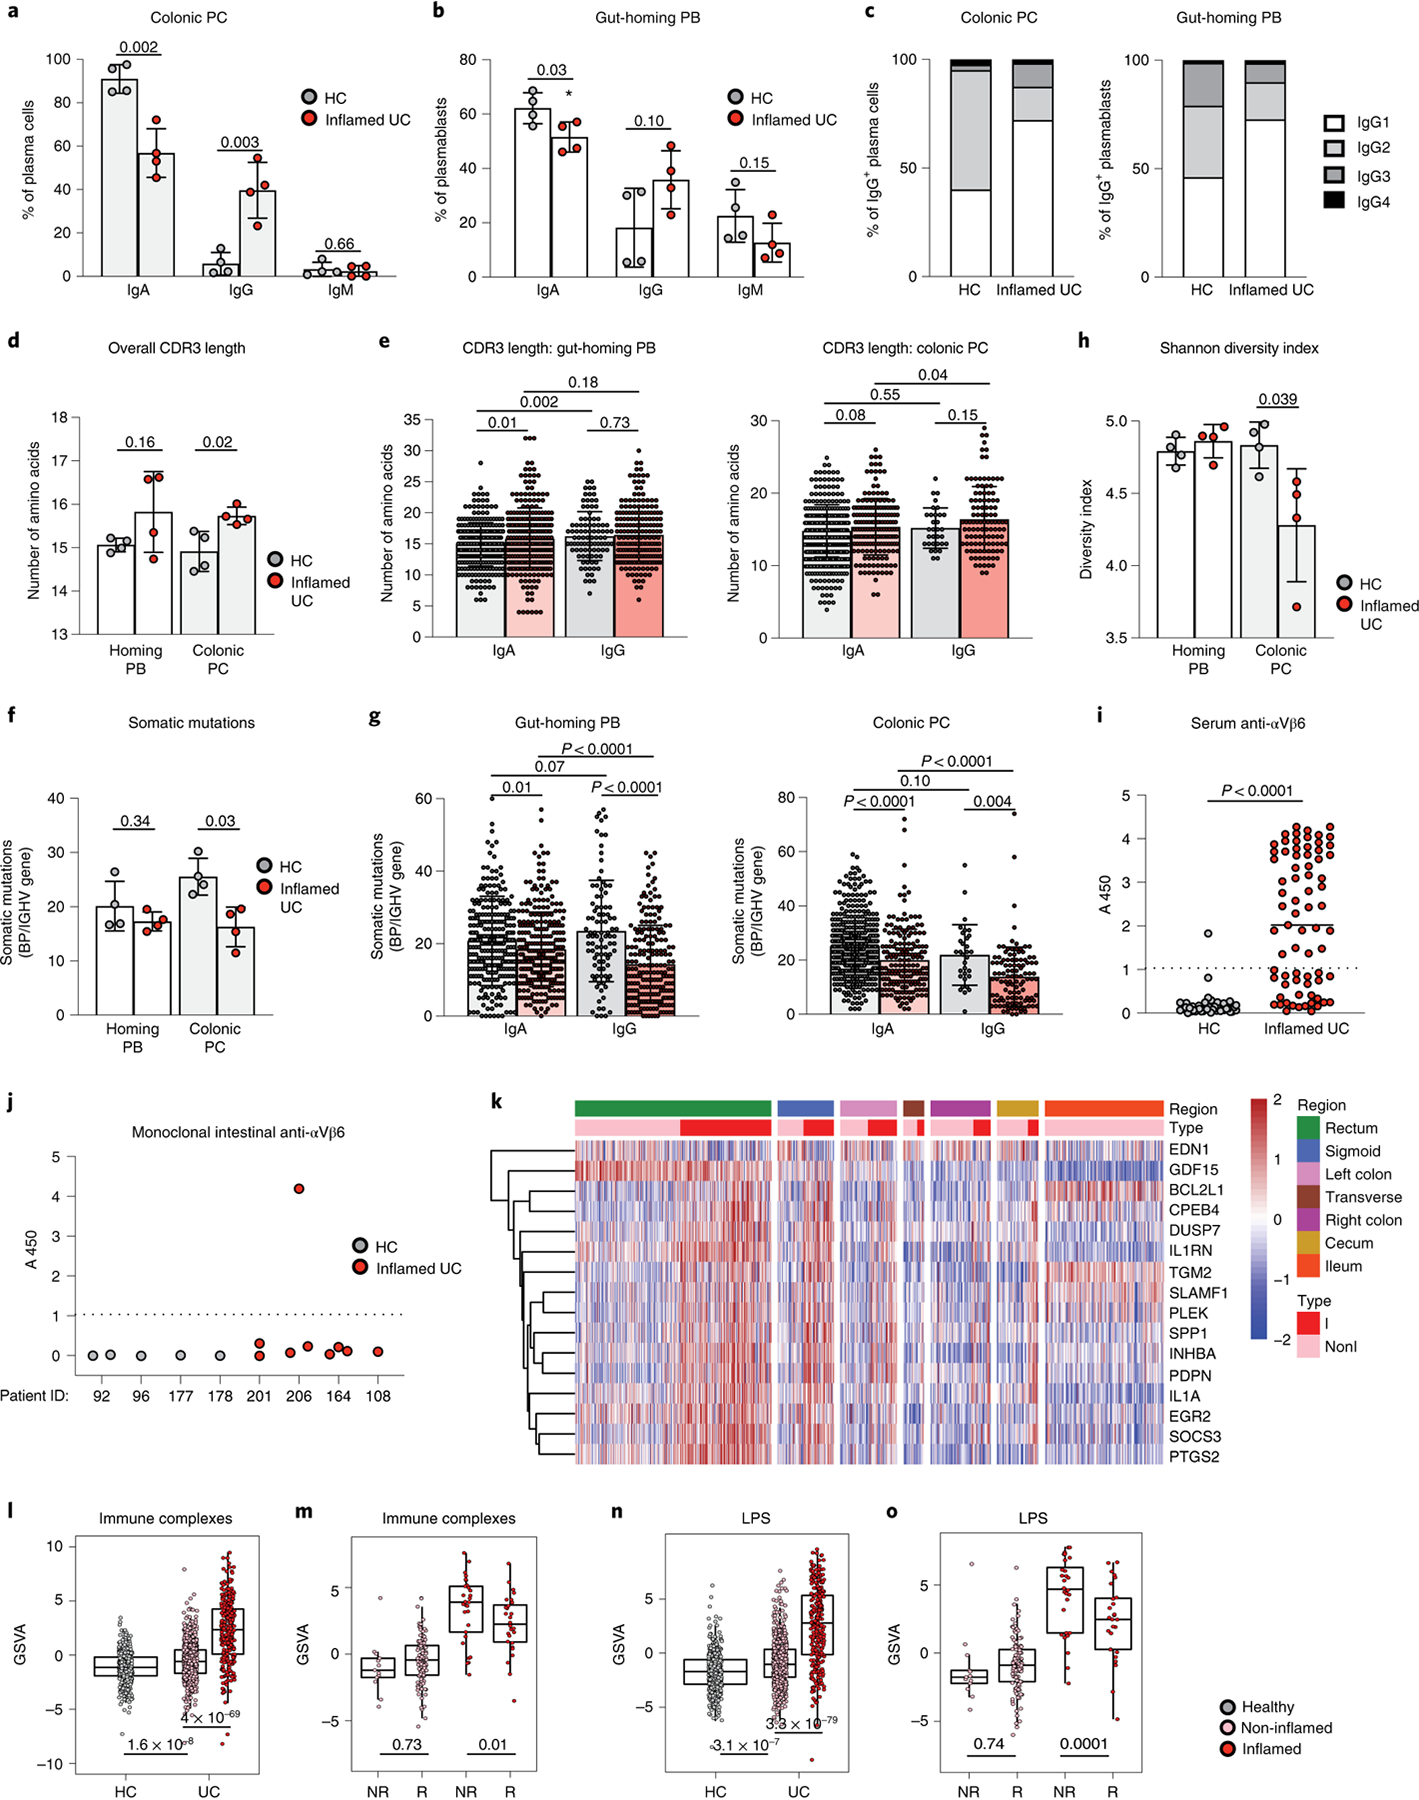
Fig. 3 |. Colonic PCs have reduced diversity, longer CDR3 regions and fewer somatic mutations in patients with UC.

a, b, Isotype frequencies in short-lived colonic PCs (CD27+CD38++CD19+CD45+) (a) and circulating gut-homing PBs (β7-integrin+CD19+/−CD38++CD27+IgD-) (b), Mann–Whitney test, two-tailed. c, Proportion of each IgG subclass in HCs and patients with UC; chi-squared test. d, e, Mean IgH amino acid CDR3 length per patient (d) for each IgA and IgG clone (e) of gut-homing PBs and short-lived colonic PCs; Mann–Whitney test, two-tailed. f, g, Mean (f) V gene somatic mutations for each IgA and IgG clone (g) of gut-homing PBs and short-lived colonic PCs, Mann–Whitney test, two-tailed. h, Shannon diversity index of gut-homing PBs and short-lived colonic PCs. Mann–Whitney test, two-tailed. a–h are based on four HCs and four patients with active UC. i, Serum anti-αvβ6 integrin antibodies of 45 HCs and 73 patients with UC. The cutoff absorbance value for positivity (A450, mean + 3 s.d. of the control sera), indicated by a dashed line. Mann–Whitney U-test. j, Reactivity of clones from HCs (n = 4 clones) and patients with UC (n = 9 clones) against integrin αvβ6. Dashed line is the cutoff for positivity (defined in i). k, Heat map depicting the standardized expression profiles of genes in the macrophage Fc IC signature on inflamed and non-inflamed tissue for different intestinal regions (n = 421 patients with UC). l, n, GSVA-derived scores for macrophage Fc IC and LPS (n) gene signatures in inflamed and non-inflamed biopsies (n = 421 patients with UC and 243 non-IBD controls). Mann–Whitney test, two-tailed. Effect size is shown in Supplementary Table 12. m, o, Macrophage Fc IC (m) and LPS (o) gene scores of responders (R) and non-responders (NR) in TNF inhibitor (infliximab)-treated patients with IBD before treatment initiation, Mann–Whitney test, two-tailed. Effect sizes are shown in Supplementary Table 13. For l–o, box plots represent the third quartile (top of the box), median (center lines) and first quartile (bottom of the box) of measurements, and the whiskers represent 1.5 times the interquartile range. In a, b, d, e, f, g, h, l, m, n and o, data are shown as individual data and mean, and P values are as indicated.
