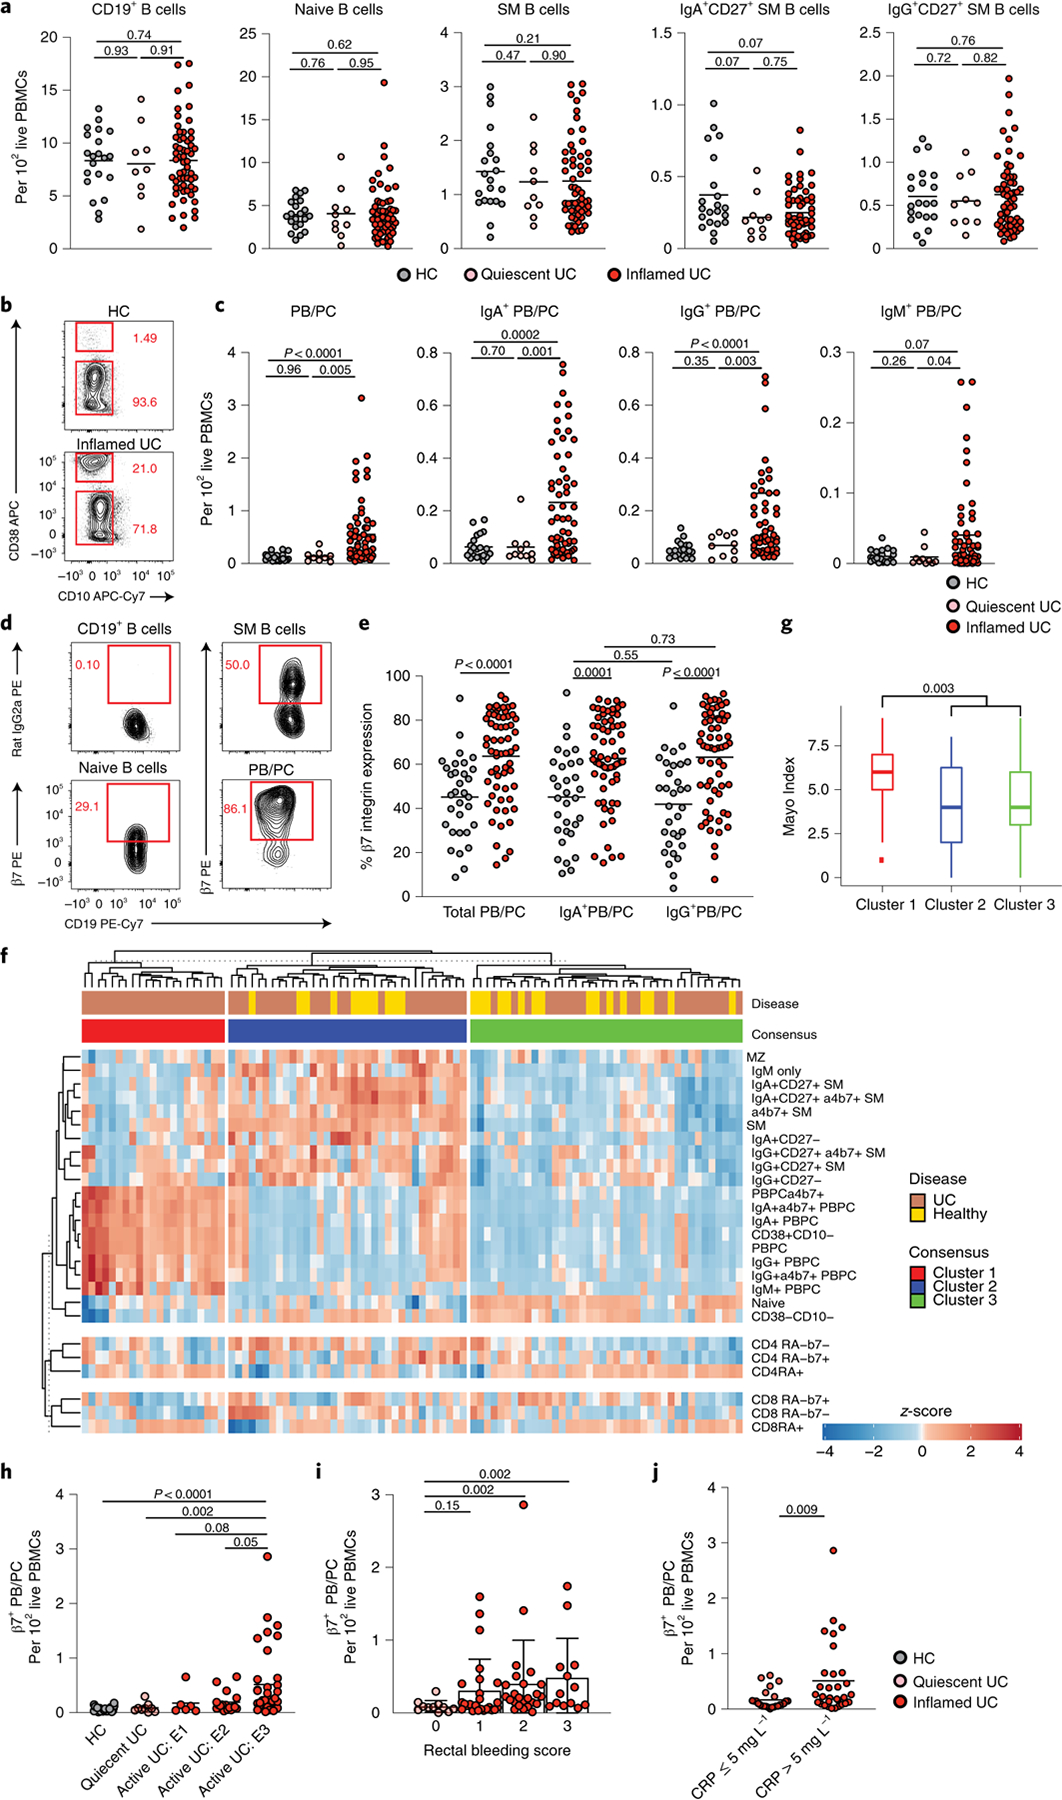
Fig. 5 |. Circulating β7-integrin-expressing PBs are expanded in patients with active UC and relate to disease activity.

a, Frequency of total B cells (CD19+), naive B cells (CD19+CD38−CD10−IgM+IgD+), CD27+ SM B cells (CD19+CD38−CD10−IgM−IgD−) and IgA+ and IgG (IgA−) SM B cells in HCs (n = 21), in patients with quiescent UC (n = 10) and in patients with active UC of the primary cohort (n = 58), Mann–Whitney test, two-tailed, b, Representative flow plots showing the frequency of CD38++CD10− cells and CD38−CD10− cells among live CD19+ PBMCs in HCs and in a patient with active UC. c, Frequency of PBs/PCs (CD19+CD38++CD10−CD27+IgD−) and IgA+ PBs/PCs, IgG+ PBs/PCs (IgA−IgM−) and IgM+ PBs/PCs out of live PBMCs in HCs (n = 21), in patients with quiescent UC (n = 10) and in patients with active UC of the primary cohort (n = 58), Mann–Whitney test, two-tailed. d, Representative flow plots of the expression of β7-integrin on SM B cells, naive B cells and PBs/PCs. e, Level of expression of β7-integrin on total, IgA+ and IgG+ PBs/PCs in HCs (n = 32) (gray) and in patients with active UC (n = 62) (red) from the primary cohort, Mann–Whitney test, two-tailed. f, Consensus clustering on primary cohort patients defined three clusters of patients and controls according to immune-phenotyping of PBMCs. g, Comparison of clinical Mayo Scores across the three consensus clusters. Box plots represent the third quartile (top of the box), median (center lines) and first quartile (bottom of the box) of measurements, and the whiskers represent 1.5 times the interquartile range, Mann–Whitney test, two-tailed. h, Frequency of β7+ gut-homing PBs/PCs (CD19+CD38++CD10−CD27+IgD−) according to their disease extent defined by the Montreal classification, Mann–Whitney test, two-tailed, n = 21 HCs, n = 9 quiescent, n = 6 active E1, n = 17 E2 and n = 35 E3. i, Frequency of β7+ gut-homing PBs/PCs according to the rectal bleeding score, Mann–Whitney test, two-tailed, n = 11, 25, 24 and 13 for rectal bleeding scores of 0, 1, 2 and 3, respectively. j, Frequency of β7+ gut-homing PBs/PCs in patients with UC with a CRP level of less than 5 mg L−1 (n = 25) or more than 5 mg L−1 (n = 31), Mann–Whitney test, two-tailed. For a, c, e, h, i and j, data are shown as individual data and mean; for h and i, data are shown as mean ± s.d. P values are as indicated throughout the figure.
