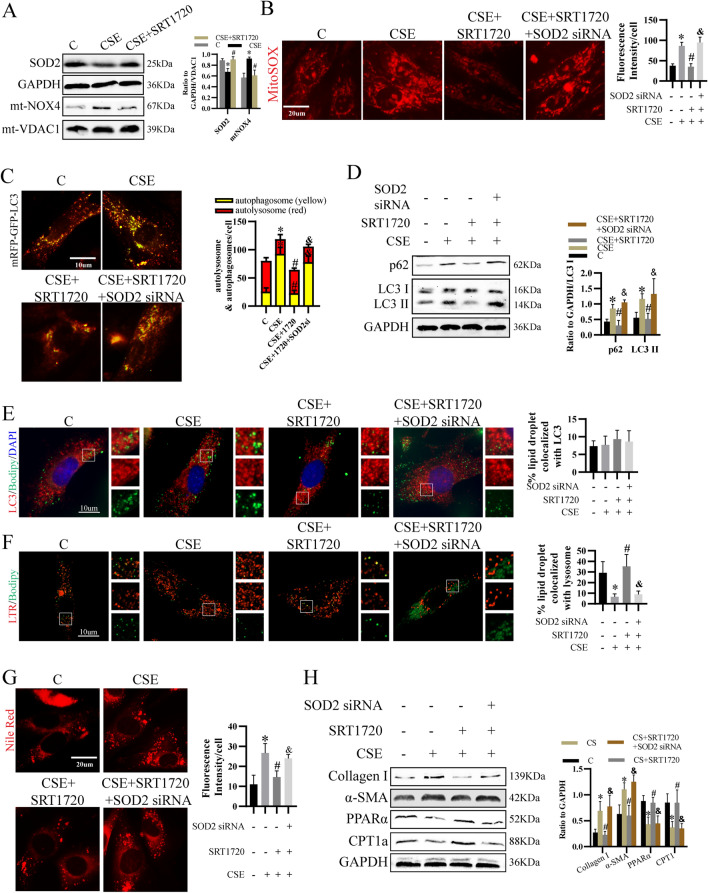
Fig. 5.
The protective effect of SIRT1 was mediated by mitochondrial redox balance. A Level of SOD2 and mtNOX4. B mtROS level were examined by mitoSOX indicator. C Autophagosomes (yellow) and autolysosomes (red) were evaluated. D SOD2 were knocked down by siRNA, followed by CSE and SRT1720 treatment. Then, p62, LC3 I and LC3 II expression was determined. E–F LC3 (E) and lysosome (F) and LDs were stained to show lipophagy. G Cellular lipid content was evaluated by Nile Red staining. H Expression of collagen I, α-SMA, CPT1a and PPARα. *p < 0.05 versus control, #p < 0.05 versus CSE, &p < 0.05 versus CSE + SRT1720 (n = 3)

