
Figure 1|. Cystic kidney disease progression differs in Pkd1RC/RC mice in various genetic backgrounds.
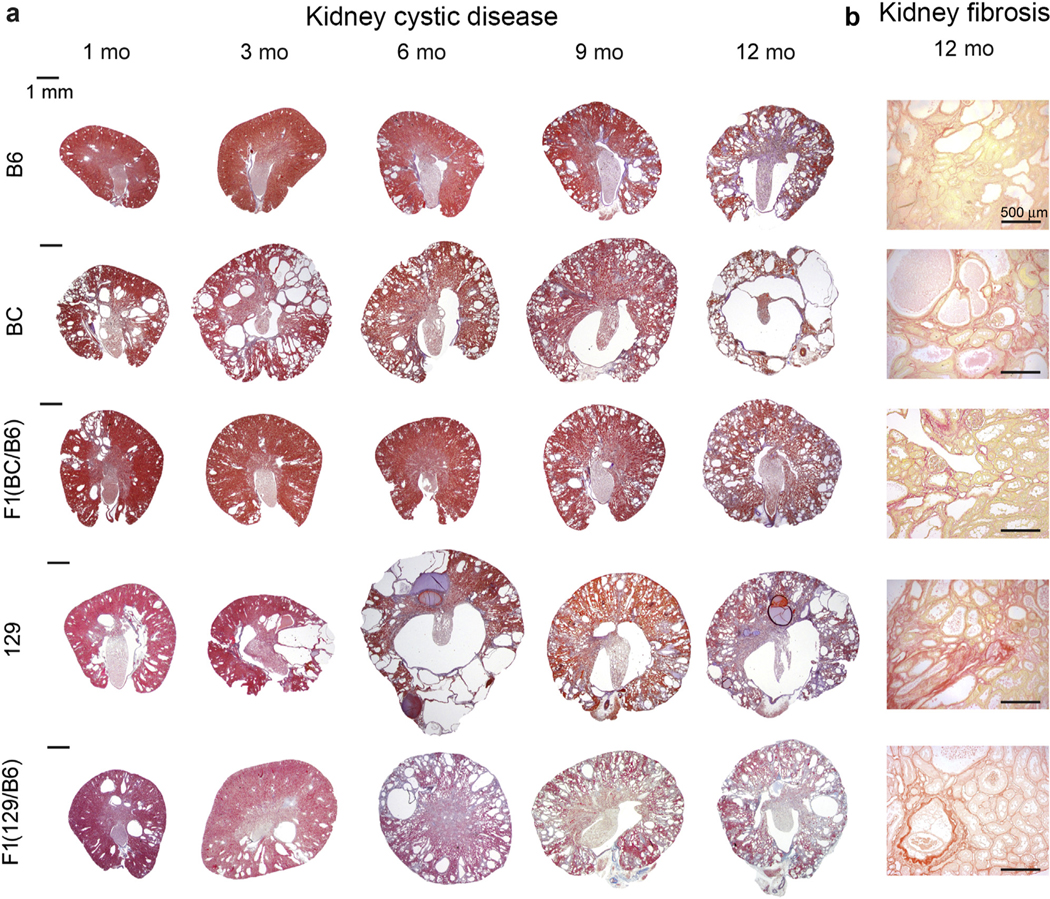
(a) Masson’s trichrome–stained kidney sections of mice at 1, 3, 6, 9, and 12 months of age showing the varying cystic disease progression between the lines. Bars = 1 mm. (b) Kidney sections of 12-month mice stained with picrosirius red illustrating fibrosis in the different lines. Bars = 500 μm. B6, C57BL/6J; BC, BALB/cJ; 129, 129S6/SvEvTac. To optimize viewing of this image, please see the online version of this article at www.kidney-international.org.