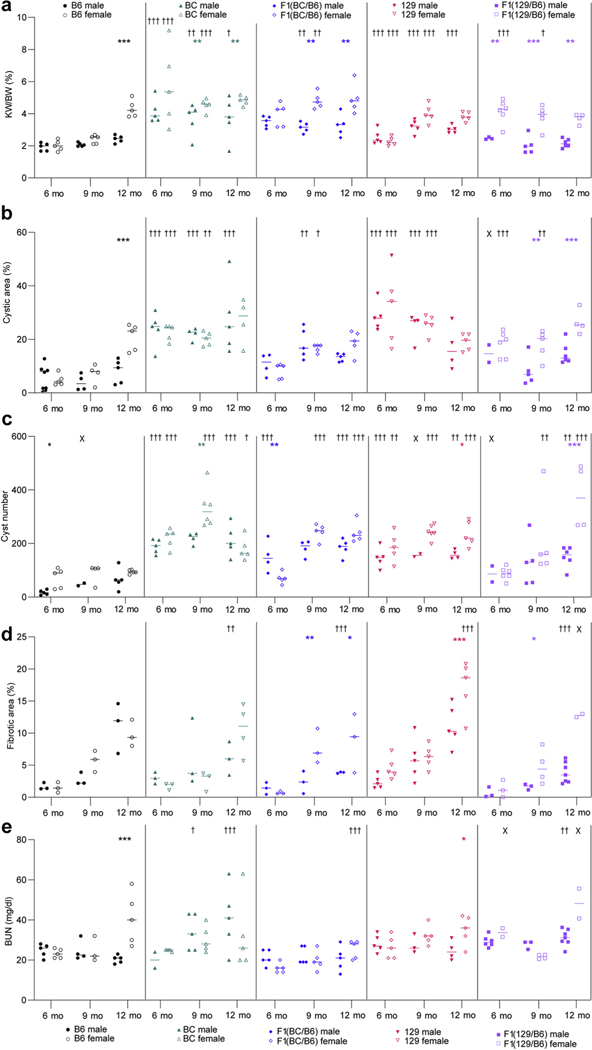
Figure 3 |. Background contributes to sex effects on cystic kidney disease progression.
(a) Percent kidney weight/body weight (KW/BW), (b) percent cystic area, (c) cyst number, (d) percent fibrotic area, and (e) blood urea nitrogen (BUN) were determined for male and female mice from each background that were killed at 6, 9, and 12 months (see Table 1 for numbers of male and female mice for each endpoint). Two-way analysis of variance (ANOVA) followed by Bonferroni’s multiple comparison test was performed between male and female groups for age-matched mice of each genetic background: *P < 0.05, **P < 0.01, ***P < 0.001. Each time point in each background was also compared to corresponding B6 mice to determine differences per sex in cystic disease by using a 2-way ANOVA followed by Dunnett’s multiple comparison test: †P < 0.05, ††P < 0.01, †††P < 0.001 (see Supplementary Table S1 for details of younger animals). Statistical analysis was performed only on groups that contained N ≥ 3, and groups not analyzed are marked with X. B6, C57BL/6J; BC, BALB/cJ; 129, 129S6/SvEvTac.

