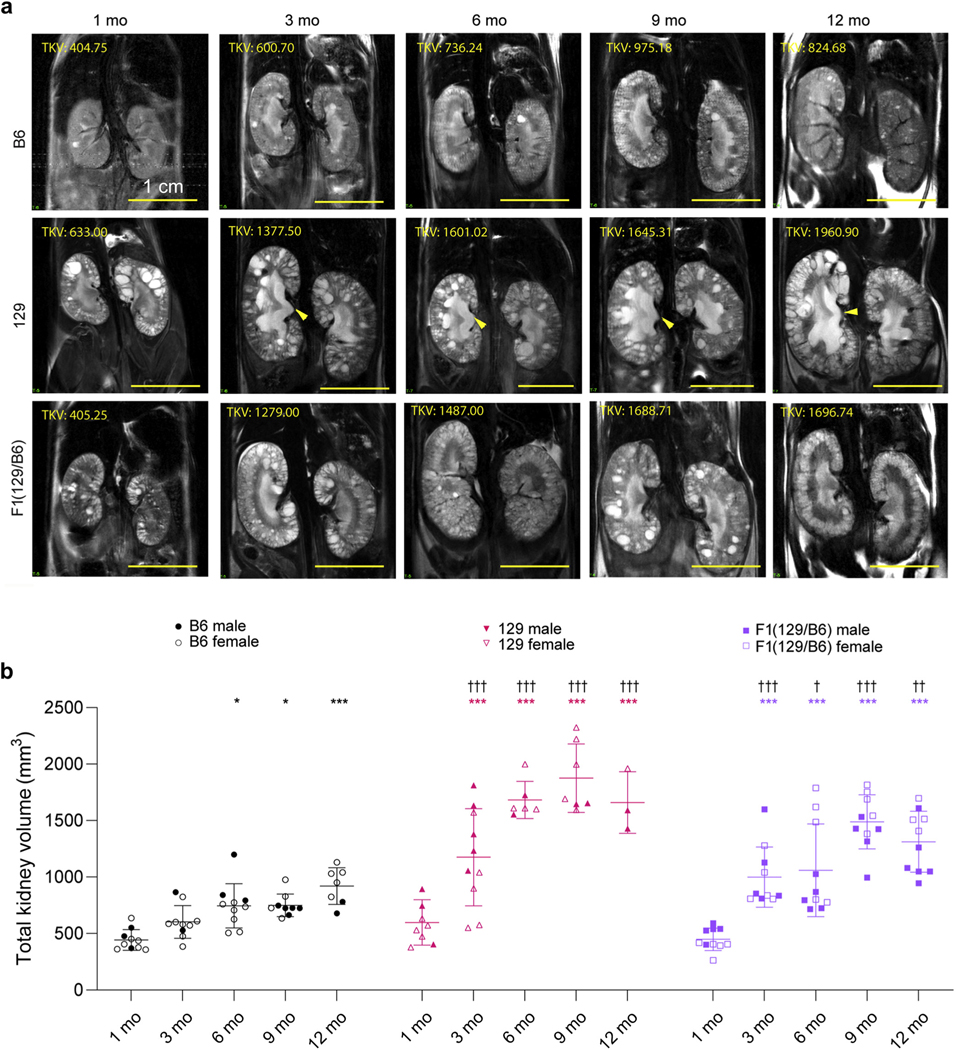
Figure 5 |. Magnetic resonance (MR) imaging of the kidney from live Pkd1RC/RC mice in different backgrounds from 1 to 12 months.
(a) Representative kidney coronal sections in C57BL/6J (B6), 129S6/SvEvTac (129), and F1(129/B6) Pkd1RC/RC mice at 1, 3, 6, 9, and 12 months. Note that different animals were imaged at each time point. The arrow indicates urine retention, and total kidney volume (TKV, in cubic millimeters) is shown. Bars = 1 cm. (b) Quantification of TKVs from MR images. Significance of the difference within each background compared to 1 month baseline was determined using a 1-way analysis of variance (ANOVA) followed by Dunnett’s multiple comparison test: *P < 0.05, **P < 0.01, ***P < 0.001. Significance of the TKV difference from age-matched B6 mice was determined using a 2-way ANOVA followed by Dunnett’s multiple comparison test: †P < 0.05, ††P < 0.01, †††P < 0.001. Statistical analysis was performed only on groups that contained N ≥ 3. To optimize viewing of this image, please see the online version of this article at www.kidney-international.org.

