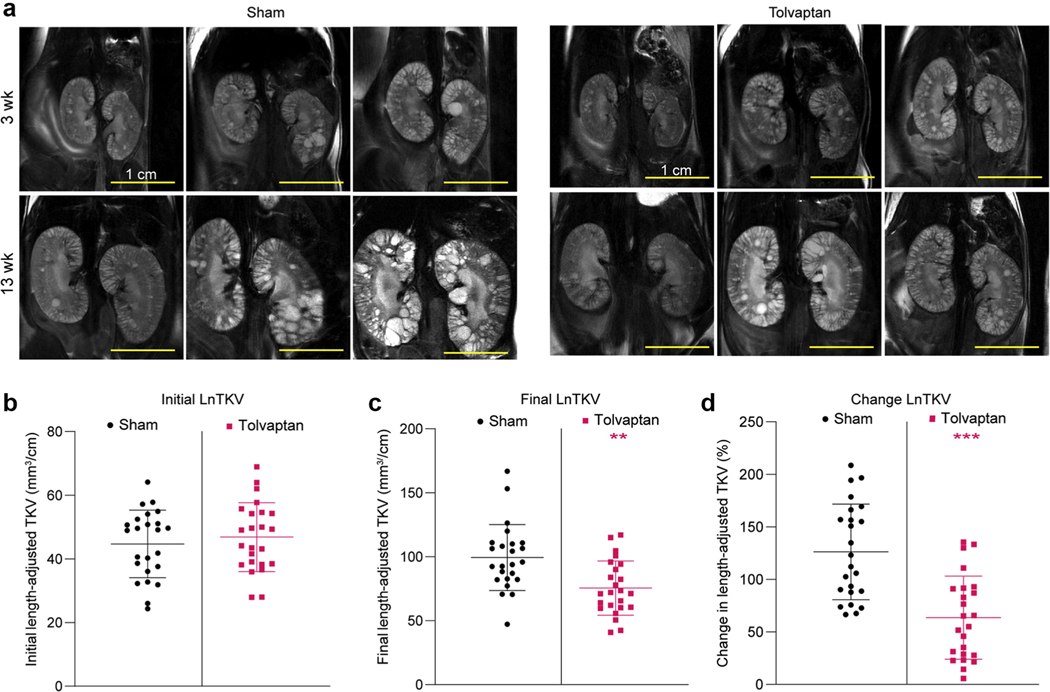
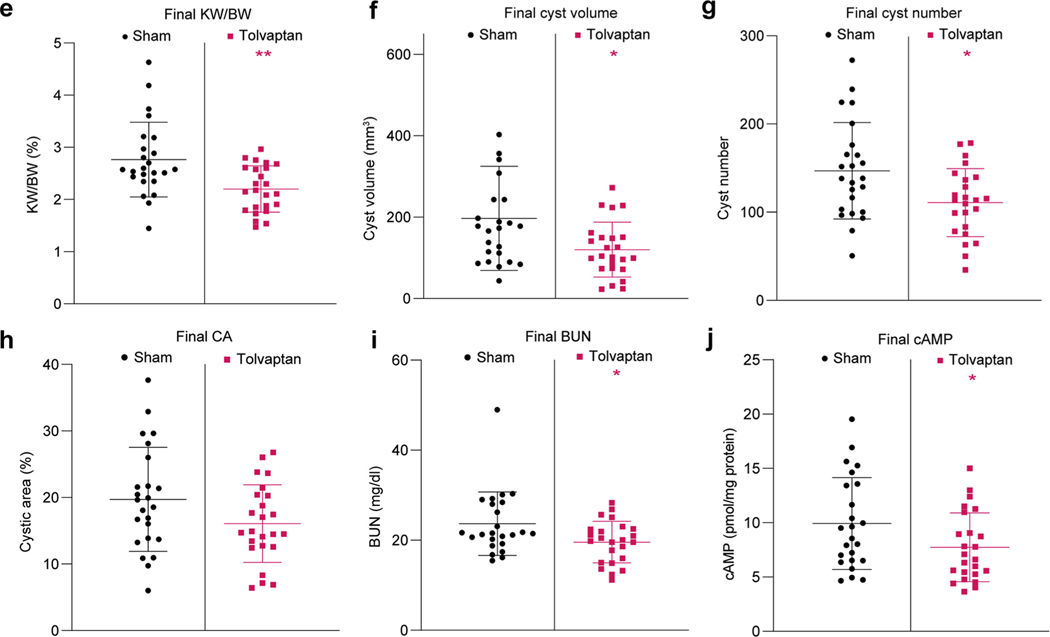
Figure 6 |. Preclinical testing of tolvaptan in F1(129/B6) Pkd1RC/RC mice.
(a) Magnetic resonance images at the start (3 weeks) and end (13 weeks) of the study in the sham and tolvaptan-treated groups (same animals at both time points). Bars = 1 cm. (b) Initial total kidney volume (TKV) adjusted for animal length (LnTKV) (3 weeks) in the sham and tolvaptan-treated groups. Corresponding final data (13 weeks) for the endpoints: (c) LnTKV, (d) percent change in LnTKV, (e) percent kidney weight/body weight (KW/BW), (f) cyst volume, (g) cyst number, (h) percent cystic area, (i) blood urea nitrogen (BUN), and (j) cyclic adenosine monophosphate (cAMP) for the sham and tolvaptan-treated groups (see also Supplementary Table S3). Significant difference between the sham and tolvaptan-treated groups was determined using an unpaired t test: *P < 0.05, **P < 0.01, ***P < 0.001. B6, C57BL/6J; 129, 129S6/SvEvTac. To optimize viewing of this image, please see the online version of this article at www.kidney-international.org.


