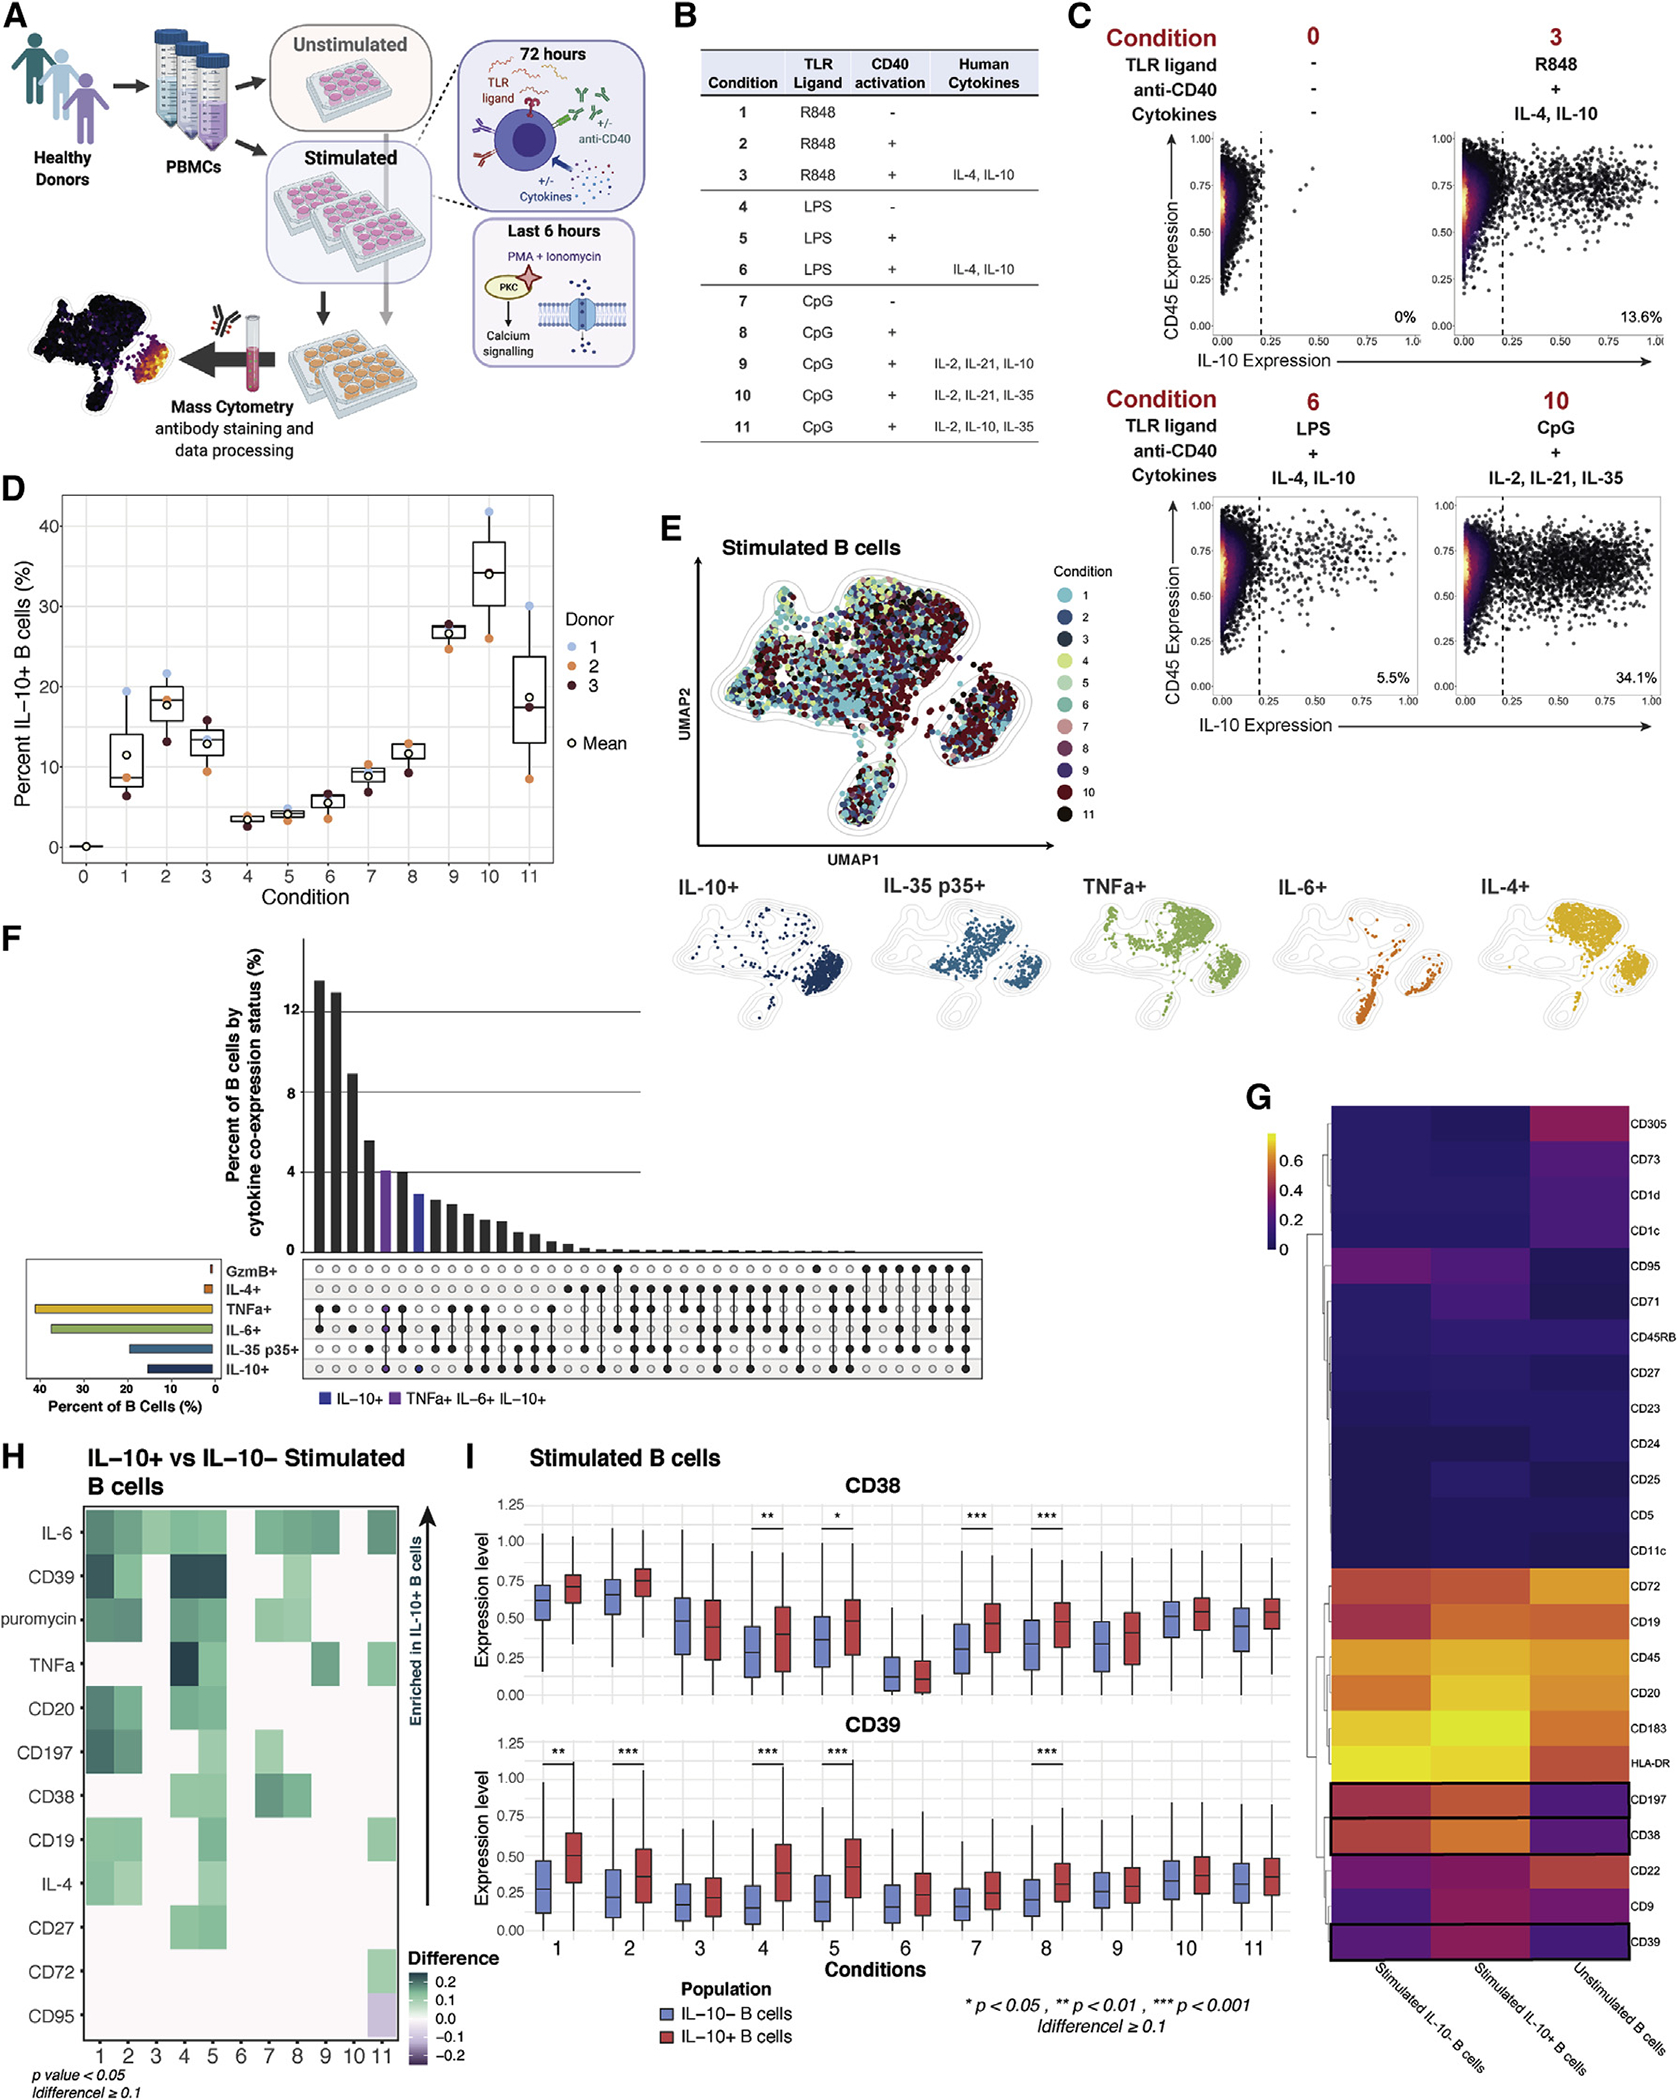
Figure 1. IL-10+ B cell immunophenotype and cytokine production vary by activation microenvironment.

(A) Experimental workflow; n = 3 healthy individuals.
(B) Summary of in vitro stimulatory conditions.
(C) Exemplative biaxial plots demonstrating differential IL-10 expression by B cells from pooled donors under varying stimulation conditions. Unstimulated cells are depicted as condition 0.
(D) Percentage of IL-10+ B cells by condition and by individual (dots). Unstimulated B cell data are depicted as condition 0. Line depicts median, box depicts interquartile range (IQR), and whiskers depict IQR + −1.5*IQR.
(E) UMAP projection of donor-pooled B cells colored by stimulatory condition (top panel) and by positive status of the indicated cytokine (bottom panels). Mass-cytometry data were subsampled equally by condition. Manifold was derived using only expression of phenotypic markers.
(F) Top bar graph indicates the percentage of stimulated B cells by cytokine and GzmB expression status, as determined by Boolean gating of cytokine-positive cells. Co-expression status of populations are defined in the bottom dot-plot panel. Left bottom bar graph depicts percentage of cytokine/GzmB-positive B cells, regardless of co-expression, across conditions. Data were subsampled equally by condition.
(G) Median surface-marker expression for unstimulated B cells and IL-10+- and IL-10−-stimulated B cell subsets. Boxes indicate non-lineage markers with significant upregulation in IL-10+ B cells in 4 or more (of 11) stimulatory conditions.
(H) Relative difference in median expression of surface markers and cytokines in IL-10+- versus IL-10−-stimulated B cells by activating condition (1–11). Expression only shown for markers and cytokines with a difference greater than or equal to 0.1 and a p value less than 0.05. p values denote result of KS test with Bonferroni correction.
(I) Expression levels of CD38 and CD39 for IL-10− (blue) versus IL-10+ (red) B cells by stimulation condition. p values denote results of KS test with Bonferroni multiple-hypothesis correcting. Line depicts median, box depicts IQR, and whiskers depict IQR + − 1.5*IQR. *p < 0.05, **p < 0.01, and ***p < 0.001, and expression difference >0.1.
