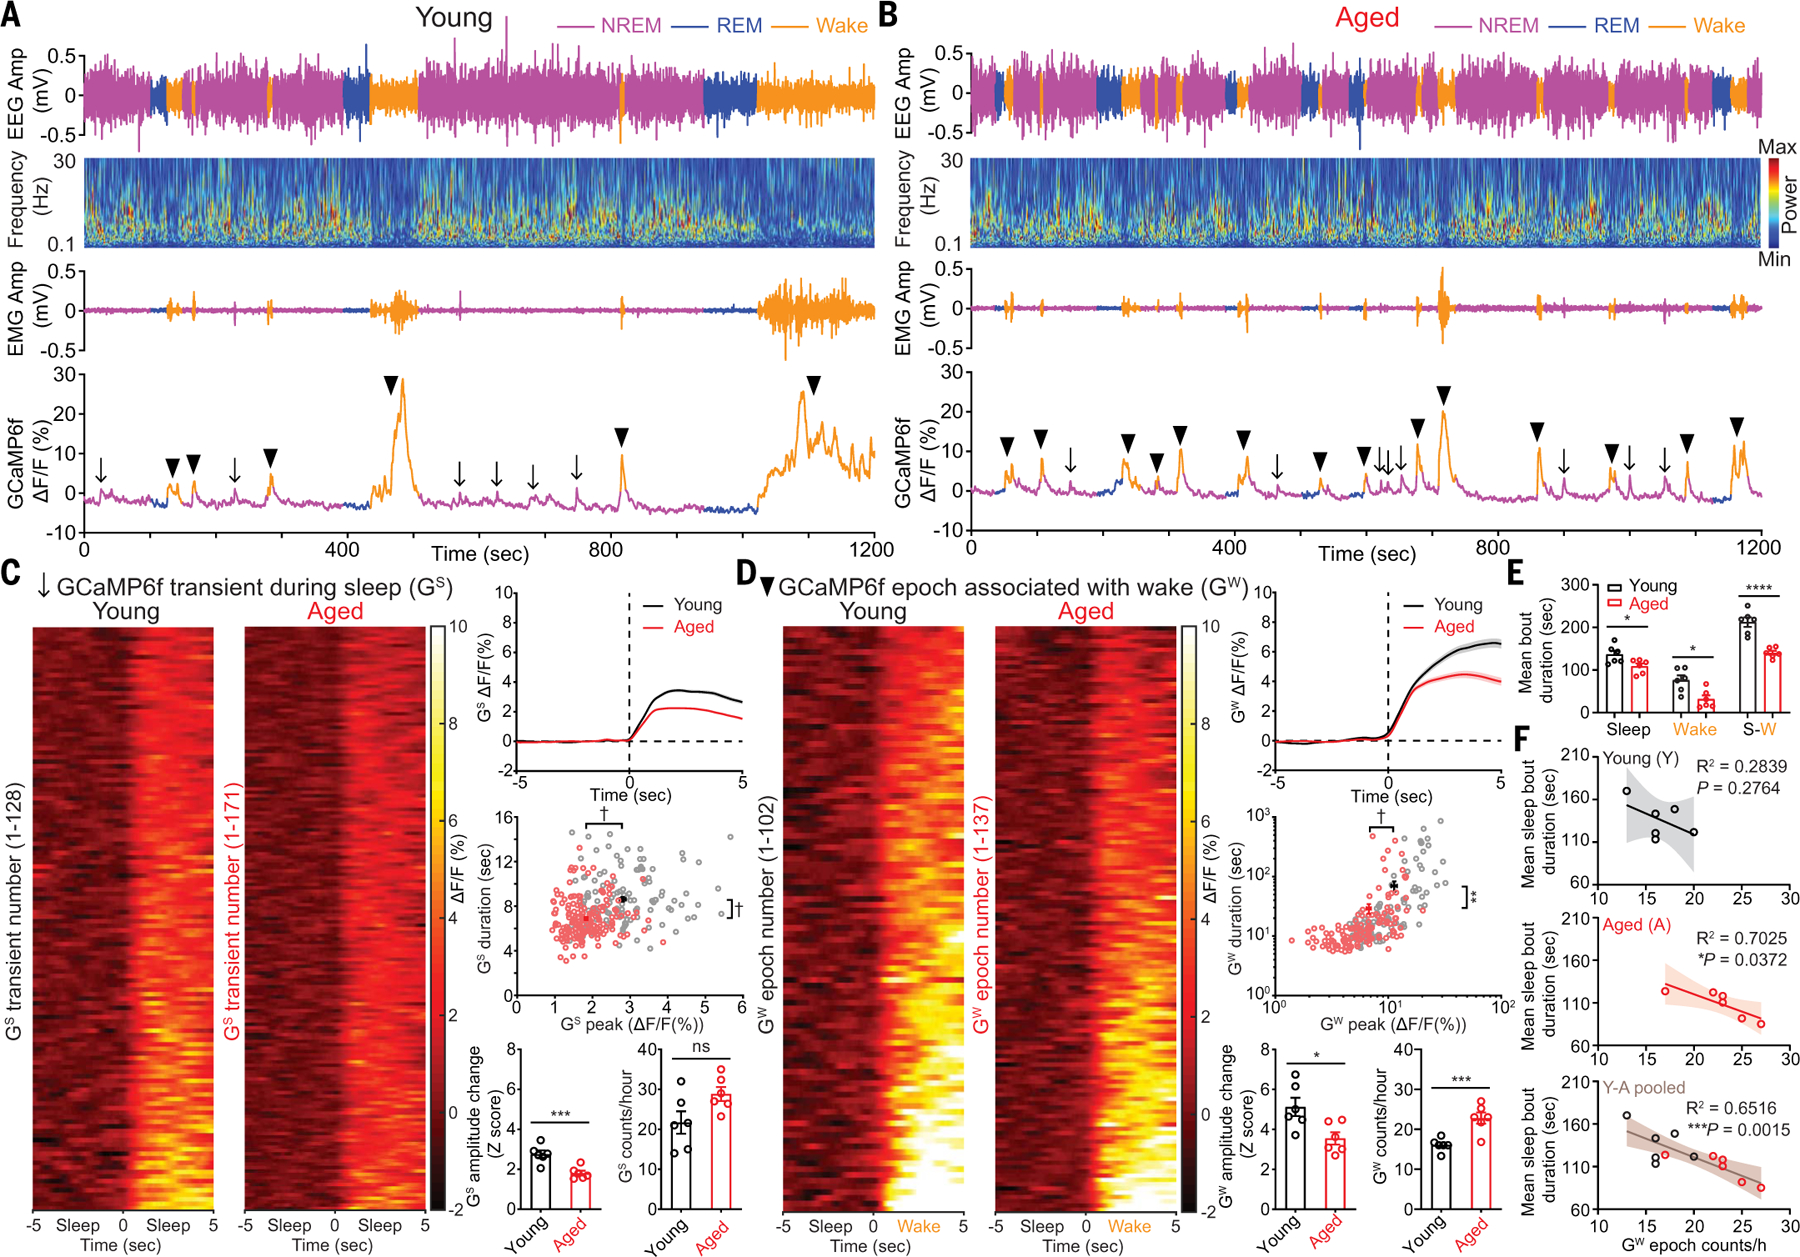
Fig. 1. Spontaneous activity of Hcrt neurons across sleep/wake states in young and aged mice.

(A and B) Representative EEG, EEG power spectra, EMG, simultaneous Hcrt GCaMP6f signals from (A) young and (B) aged mice. The arrows indicate GCaMP6f transients during sleep (GS), and the black triangles indicate GCaMP6f epochs associated with wakefulness (GW). (C) Staged GS signals during 10 s around the start of GS transients from identical length (6 hours, 1 hour/mouse) of recorded GCaMP6f signals from young and aged mice (n = 6 mice each group), respectively, during light phase, averaged trace plot (right top), scatter plot of individual GS duration against GS peak (young, n = 128; aged, n = 171) (right middle), animal-based comparison of GS signals for Z score and GS frequency (right bottom). (D) Staged GW signals during 10 s around start of GW epochs from identical length (6 hours, 1 hour/mouse) of recorded GCaMP6f signals from young and aged mice, averaged trace plot (right top), scatter plot of individual GW duration against GW peak (young, n = 102; aged, n = 137) (right middle), animal-based comparison of GW signals for Z score and GW frequency (right bottom). (E) Animal-based comparison of mean bout duration for sleep, wake, and entire S-W episodes (n = 6 mice each group). (F) Correlation for mean sleep bout duration against GW bout counts/hour in young, aged, and pooled datasets. Data represent mean ± SEM. In (C) to (E) unpaired t test with Welch’s correction; (F), Spearman correlation, linear fit and 95% confidence band; *P < 0.05, **P < 0.01, ***P < 0.005, ****P < 0.001, †P < 0.0005; statistical details see supplementary text.
