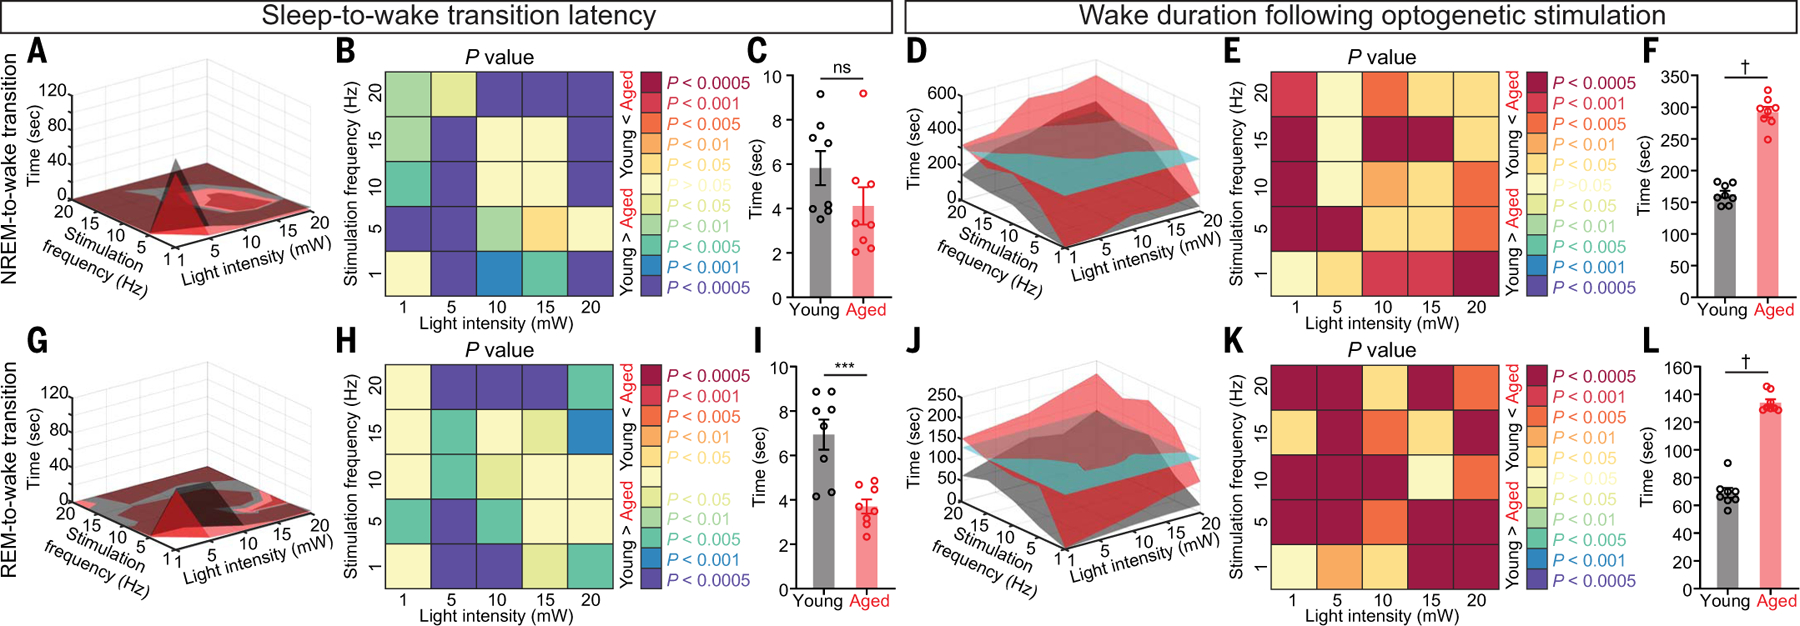
Fig. 2. More prolonged wake bouts upon optogenetic stimulation of Hcrt neurons expressing ChR2-eYFP in aged mice.

(A) Surface plot of NREM-to-wake transition latency based on the mean value of each stimulation condition. (B and C) Comparison of NREM-to-wake transition latency based on (B) each stimulation condition and (C) the mean value for each animal. (D) Surface plot of wake duration based on the mean value of each stimulation condition. The cyan cutaway surface indicates the mean value for the aged group. (E and F) Comparison of wake duration based on (E) each stimulation condition and (F) the mean value for each animal. (G) Surface plot of REM-to-wake transition latency based on the mean value of each stimulation condition. (H and I) Comparison of REM-to-wake transition latency based on (H) each stimulation condition and (I) the mean value for each animal. (J) Surface plot of wake duration based on the mean value of each stimulation condition. The cyan cutaway surface indicates the mean value for the aged group. (K and L) Comparison of wake duration based on (K) each stimulation condition and (L) the mean value for each animal. In (B), (C), (E), (F), (H), (I), (K), and (L): Mann-Whitney U test; ***P < 0.005, †P < 0.0005. Statistical details are available in the supplementary text.
