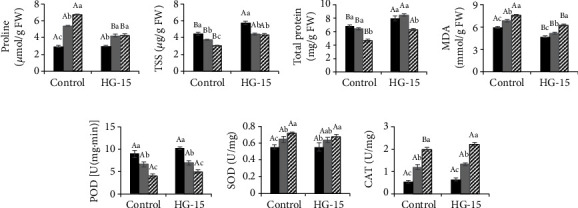
Figure 5.

Effect of B. subtilis HG-15 inoculation on (a) proline, (b) TSS, (c) total protein, (d) MDA, (e) POD, (f) SOD, and (g) CAT under different NaCl salinity conditions. Data are shown as the mean ± standard deviation (n = 5). Capital letters indicate the difference between CK and HG-15 inoculation under the same salt concentration (Student's t test, p < 0.05), whereas lowercase letters indicate differences under the three different salt concentrations in the control (or HG-15) group (one-way ANOVA, p < 0.05).
