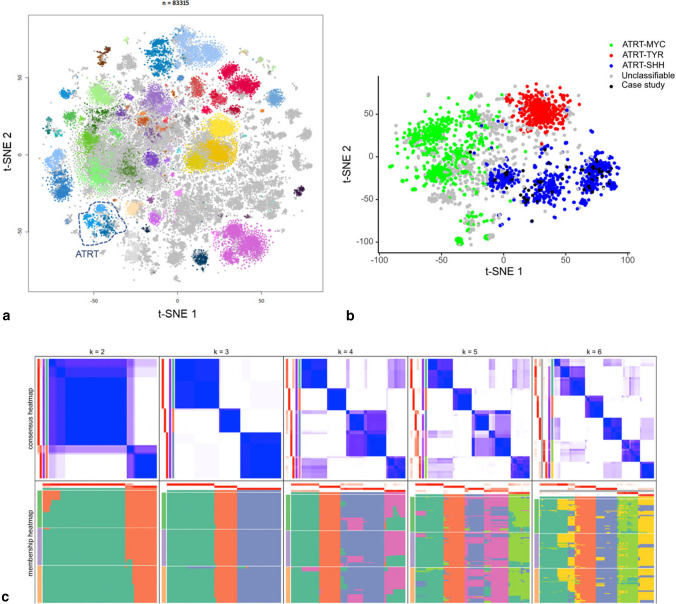
Fig. 1.
DNA methylation profiling of ATRT–SHH reveals three distinct molecular subgroups. Unsupervised t-SNE analysis of the tumor cases together with > 83.000 samples of the molecularneuropathology.org data set (a) segregates ATRT–SHH into three DNA methylation subgroups. A more focused analysis of the ATRT cases within the Heidelberg data set (n = 1919) further suggests the presence of three ATRT–SHH subgroups (b). Black dots indicate the cases of this study. Unsupervised clustering analysis using spherical k-means clustering for k = 2–6 revealed most stable consensus heatmaps and membership partitioning for k = 3 clusters (c)

