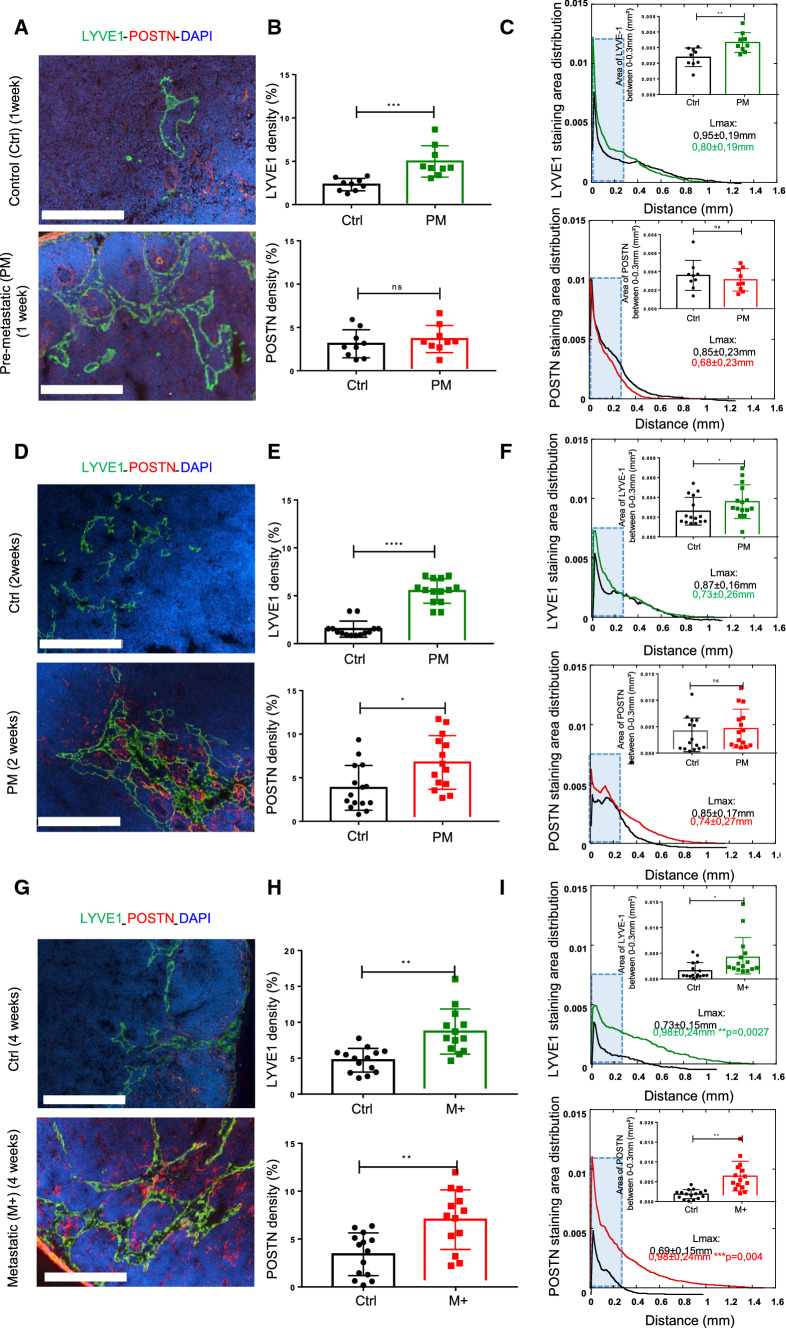
Fig. 2.
POSTN is upregulated in (pre)-metastatic LN. Morphometric analysis of POSTN and LYVE1+ lymphatic vessels in experimental (pre)-metastatic LN (in the ear sponge assay using B16F10 cells). CTRLs correspond to mice implanted with a sponge without tumor cells. a–d–g Immunostaining of POSTN (red) and LYVE1 (green) in pre-metastatic (PM) (at 1 week in A, at 2 weeks in d) and in metastatic (M+) LNs (G). Bars = 250 µm. b–e–h Scatter graphs use scatter plots to represent POSTN and LYVE1 densities (in percentage) assessed by a computer assisted method (n ≥ 9). Results are expressed as mean ± SD, and statistical analyses were performed using a Wilcoxon–Mann–Whitney test (*p < 0.05; **p < 0.01; ***p < 0.001; ****p < 0.0001). c–f–i Spatial distribution analysis from tissue edge to tissue center. The blue rectangle indicates the area between 0–0.30 mm from the LN border where the cumulate normalized areas of LYVE1 and POSTN were measured and represented in the top right. Maximum distance of migration from the tissue border (Lmax) is indicated. Results are expressed as mean ± SD (Wilcoxon–Mann–Whitney test: *p < 0.05; **p < 0.01). d–i All the results represent the set of two independent experiments

