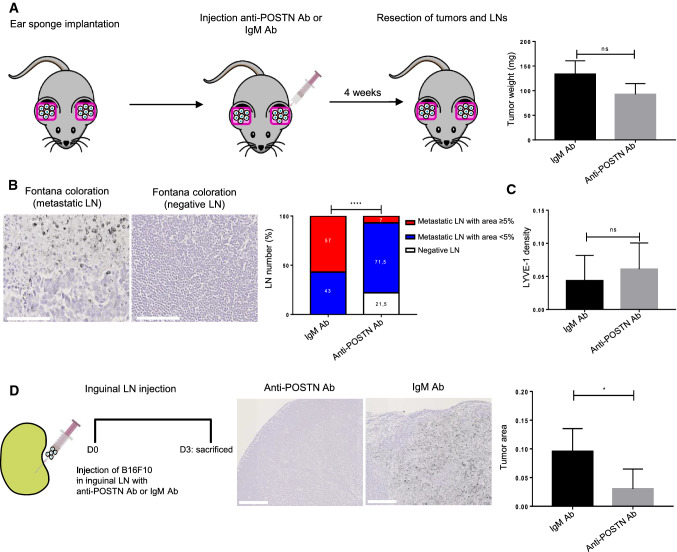
Fig. 4.
POSTN blocking antibody reduces LN invasion in vivo. a Schematic representation of the ear sponge assay. POSTN blocking antibody (Ab) or IgM Ab (ctrl) was injected into the sponge soaked with B16F10, twice a week, for a period of 4 weeks. The histogram represents the tumor weight (mg) at the end of the assay (n ≥ 15). b Fontana staining to detect tumor cells in a positive (metastatic, left) and negative (right) LNs. Bars = 100 µm. Histogram represents the metastatic index: percentage of metastasis-free LN (negative LNs in white), positive LNs with a metastases area < 5% (low metastatic index in blue) and positive LNs with metastases area ≥ 5% (high metastatic index in red) in both groups (anti-POSTN Ab and IgM Ab). Statistical analyses were performed using Chi-square (****p < 0.0001) c Morphometric analysis of LYVE1 lymphatic vessels in LNs treated with anti-POSTN or IgM Ab. The scatter graph uses dots to represent LYVE1 density assessed by a computer assisted method. Results are expressed as mean ± SD (Wilcoxon–Mann–Whitney test). d Schematic representation of the intra-nodal injection of B16F10 cells (with anti-POSTN or IgM) using a Hamilton syringe. Fontana staining to detect tumor cells in LNs treated with anti-POSTN or IgM Ab. Bars = 250 µm. Histogram represents the tumor area (surface occupied by tumor cells divided by total surface of LN). Results are expressed as mean ± SD (n ≥ 6) (Wilcoxon–Mann–Whitney test (*p < 0.05)

