Fig. 6.
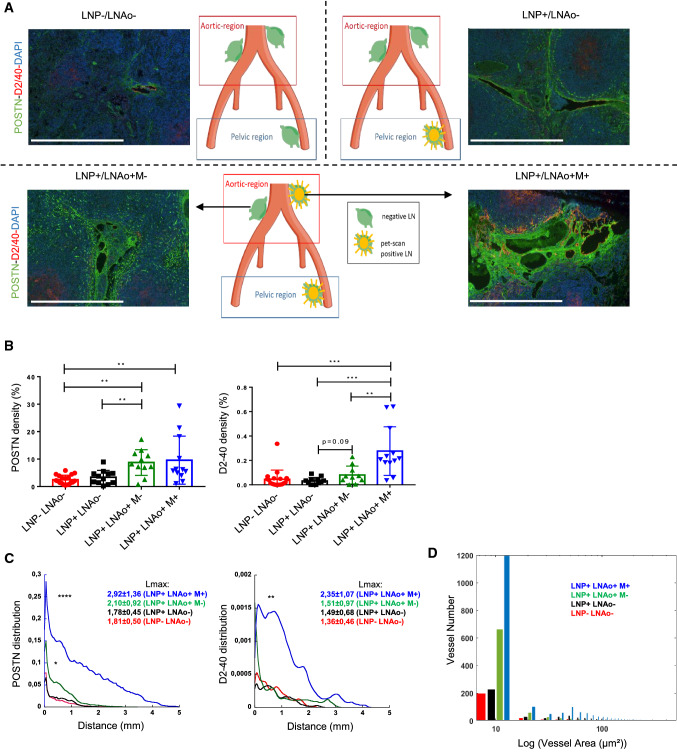
POSTN is increased in locally advanced cervical cancer. Analysis of POSTN and lymphatic network in patients with no LN metastasis (LNP−/LNAo−), one metastatic pelvic LN but none in para-aortic (LNP+/LNAo−) and pelvic and para-aortic metastatic LNs (LNP+/LNAo+ M+). In this group, the surrounding negative para-aortic LN was analyzed (LNP+/LNAo+ M−) as presented in the schema in which, green and yellow LNs correspond to the pet-scan status (negative in green or positive in yellow). a Double immunostaining of POSTN (green), Podoplanin (D2-40) (red) and nuclei (DAPI, blue). Scale bars represent 500 µm. b A computer-assisted analysis of POSTN and Podoplanin densities (in percentage) in LNP−LNAo− (red), LNP+LNAo− (black), LNP+LNAo+ (green) and LNP+LNAo+M+ (blue). Graphs are presented as mean ± SD and statistical analyses were performed using a Wilcoxon–Mann–Whitney test: (p* < 0.05; p** < 0.01; p*** < 0.001). c Spatial lymphatic vessel and POSTN distribution from tissue edge to tissue center measured on whole tissues of LNP−LNAo−, LNP+LNAo−, LNP+LNAo+ and LNP+LNAo+M+. Statistical analyses were performed using a Kolmogorov Smirnov test (*p < 0.05, **p < 0.01, ****p < 0.0001). Maximum distance of migration from the tissue border (Lmax) is indicated and expressed as mean ± SD. (p* < 0.05; p** < 0.01; p**** < 0.0001). d Lymphatic vessel size distribution in of LNP-LNAo− (red), LNP+LNAo− (black), LNP+LNAo+ (green) and LNP+LNAo+M+ (blue)

