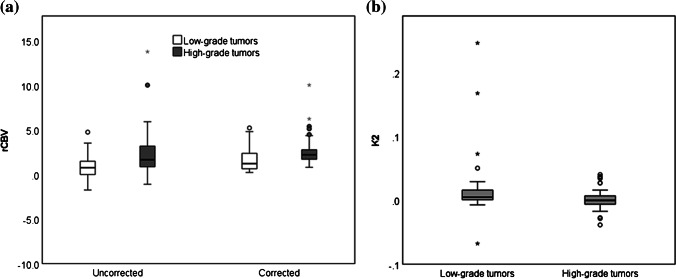
Fig. 5.
Boxplots show parameter distributions across the high-grade and low-grade tumor groups, respectively. a, b Median uncorrected relative cerebral blood volume (rCBVuncorr) and corrected relative cerebral blood volume (rCBVcorr) (a) and median K2 (b). The bold lines show the mean parameter, whiskers show the interquartile range. The P-values from the Kruskal-Wallis tests for significant differences in parameters between the high-grade and low-grade tumor groups were significant at 0.008, 0.010 and 0.014 for rCBVuncorr, rCBVcorr and K2, respectively

