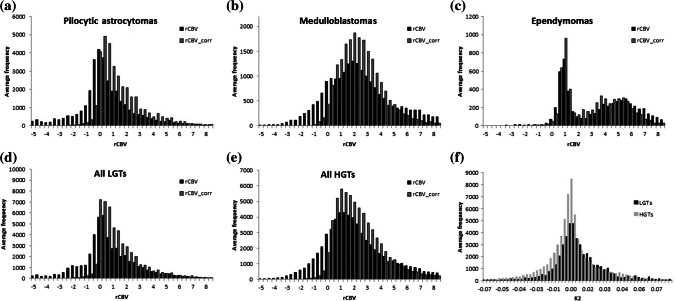
Fig. 7.
Mean histograms show the distribution of uncorrected and corrected relative cerebral blood volume (rCBV) averaged over (a) all pilocytic astrocytomas (n=27), (b) all medulloblastomas (n=23), (c) all ependymomas (n=9), (d) all other low-grade tumors (LGTs) (n=10), (e) all other high-grade tumors (HGTs) (n=7) and (f) the distribution of the leakage parameter (K2) averaged over the low- and high-grade tumor groups, respectively

