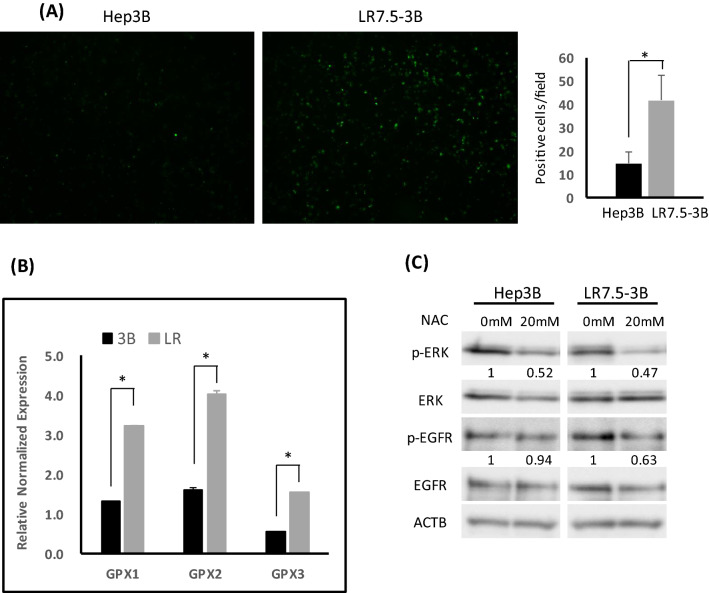
Figure 6.
Involvement of ROS in EGFR and ERK activation in lenvatinib-resistant cells. (A) Hep3B and LR7.5-3B cells were treated with DCFH-DA for 30 min on the day of use, then washed twice with the same amount of Hank’s Balanced Saline Solution ( +); ROS content was analyzed using the all-in-one fluorescence microscope BZ-X800. Graphs were average of positive cells in the 12 field. (B) Real-time PCR analysis of the glutathione peroxidase (GPX1-3) gene in Hep3B (3B) and LR7.5-3B (LR) cells. Two independent experiments of were performed, and representative results are shown. (C) Immunoblotting analysis of phosphorylated ERK (p-ERK), ERK, phosphorylated EGFR (p-EGFR), EGFR and ACTB levels in Hep3B and LR7.5-3B cells that had been treated with or without 20 mM NAC for 1 h. The intensity with the internal control were indicated. Two independent experiments were performed, and representative results are shown. *p < 0.05.

