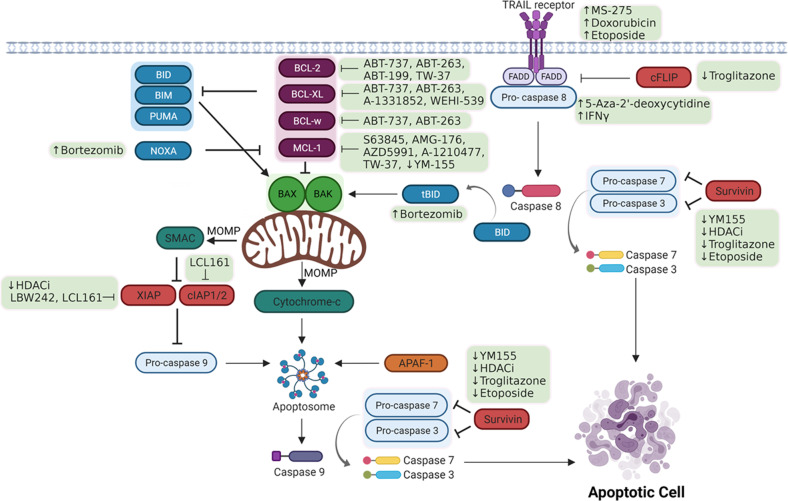
Fig. 1. Schematic representation of the extrinsic and intrinsic apoptosis pathways, indicating pharmacological agents and their therapeutic targets.
Proteins mediating similar functions are indicated by shading, while green shaded boxes highlight pharmacological agents. ↑ and ↓ indicates that the target is upregulated or downregulated by the drug, respectively. --| indicates inhibition of the target protein by the specified protein/drug. Created with BioRender.com.

